Badges as Visible Formative Feedback in Arduino PBL
Badges as Visible Formative Feedback in Arduino PBL
Badges as Visible Formative Feedback in Arduino PBL
Christian
Pérez Bernal
 ,
Miguel A. Salido
Department of Computer Systems and Computation (DSIC), Universitat Politècnica de València, Spain.
How to cite: Pérez Bernal, C.; Salido, M. A. (2026). Badges as Visible Formative Feedback in Arduino PBL. In: 12th International Conference on Higher Education Advances (HEAd’26). Valencia, 15-18 June 2026. https://doi.org/10.4995/HEAd26.2026.21361
Abstract
Badges are common in gamified courses, yet their role as formative assessment in hands-on laboratories remains underexplored. We report an observational study from an Arduino project-based learning (PBL) course in which eight team badges were announced at the beginning of the next class together with the reason why they had been earned, turning recognition into recurring formative feedback. Using anonymized records from one cohort (N = 30 students; 15 fixed teams), we examined whether badge score, obtained by linearly rescaling earned badges (0–8) to a weighted 0–2 component, was associated with two graded sprints and the final practical grade. Spearman correlations showed positive associations with Sprint 1 (ρ = 0.69, p < .001), Sprint 2 (ρ = 0.50, p = .005), and final grade (ρ = 0.90, p < .001). High-badge students started near the ceiling, whereas the low-badge group improved more between sprints but remained behind. We discuss how a badge-announcement routine can support formative feedback, motivational gamification, and assessment transparency in Arduino PBL while remaining cautious about causal interpretation.
Keywords: gamification; badges; formative feedback; project-based learning; physical computing; Arduino.
1. Introduction
Arduino-based physical computing is a common entry point for teaching programming and embedded systems through tangible artefacts. In higher education, these courses are often organized around project-based learning (PBL), since prototype development makes code observable and supports iterative work through milestones and demonstrations. Prior studies in microcontroller and IoT education report that such structures can improve engagement and performance when assessment routines are explicit and aligned with the development process (Hussain et al., 2024; Leitao et al., 2023; Vanitha et al., 2025).
Arduino PBL also poses a recurring challenge: feedback is costly to provide at the right moment and in a form students can immediately use. Instructors therefore need lightweight mechanisms that sustain effort and clarify “what good looks like” between graded milestones. Research on gamification in higher education supports this direction, but stresses that game elements help only when they are integrated into the learning design and make criteria more transparent (Chamorro-Atalaya et al., 2023; Monteiro et al., 2021). From a formative-assessment perspective, feedback is most useful when it is timely and actionable (Nicol & Macfarlane-Dick, 2006).
We examine badges as visible formative feedback embedded in the weekly rhythm of an Arduino PBL course. The key feature is that badges were publicly announced together with the reason they were earned, combining recognition, motivational gamification, and explicit guidance on valued practices. Because public recognition may also shape classroom norms and peer comparison, we study badges as formative feedback while remaining attentive to their broader social meaning. We address two research questions: (RQ1) How does badge accumulation relate to between-sprint progression across two project milestones? (RQ2) To what extent do badges associate with final performance indicators in this Arduino PBL course?)
2. Related Work
This section situates the contribution at the intersection of gamification, badges, and PBL in microcontroller education, focusing only on design considerations that motivate the intervention.
2.1. Gamification evaluation in higher education
Gamification in higher education is commonly evaluated through engagement-related constructs and performance outcomes, although measures vary across studies (Monteiro et al., 2021). In engineering education, reviews emphasize that results depend less on the mere presence of points or badges than on alignment with intended learning practices and clear assessment rules (Chamorro-Atalaya et al., 2023). This motivates our focus on badges as an assessment-adjacent mechanism rather than as a stand-alone motivational add-on.
2.2. Badges and pedagogical integration
Badges can make progress visible and reinforce valued behaviours when they represent meaningful achievements and are understood in context (Soleymani et al., 2024). However, they lose value when criteria are opaque, inconsistently applied, or disconnected from authentic course outcomes (Pelizzari & Ferrari, 2025). Public announcements add a further layer: they communicate not only to recipients, but also to the whole class through norms, exemplars, and status cues. This can support learning by making expectations visible, but it may also encourage peer comparison. A formative interpretation is therefore strongest when badges target revisable practices and announcements explicitly state why a badge was earned.
2.3. PBL in Arduino, microcontrollers, and IoT education
PBL is particularly suitable for Arduino and IoT education because it combines programming with tangible artefacts and repeated cycles of building, testing, and revision. Studies in engineering laboratories show that milestone-based deliverables can scaffold iterative improvement and sustain engagement (Hussain et al., 2024), while work on microcontroller and IoT courses highlights the value of structured routines, demonstrations, and intermediate checkpoints (Leitao et al., 2023; Vanitha et al., 2025). Our badge-announcement routine builds on this logic by adding a lightweight visible feedback signal between graded milestones.
3. Methodology
This section describes the study context, the badge-based intervention, and the measures used to relate badge accumulation to sprint and final performance. The study is observational, so findings are interpreted as associations rather than causal effects.
3.1. Study context and intervention
The study was conducted in one Arduino course during semester A with a single cohort of 30 students organized into 15 fixed teams. The practical component spanned 10 sessions and followed a PBL structure with two graded sprints and a final integrated prototype presentation. The badge system was announced from the beginning of the course as part of the practical evaluation and was intended to make progress visible between milestones, reinforce course norms, and provide low-stakes formative feedback. Badges targeted common success factors in physical-computing projects, including making, teamwork, code quality, debugging, sprint reliability, reflection, peer support, and overall mastery (Figure 1).
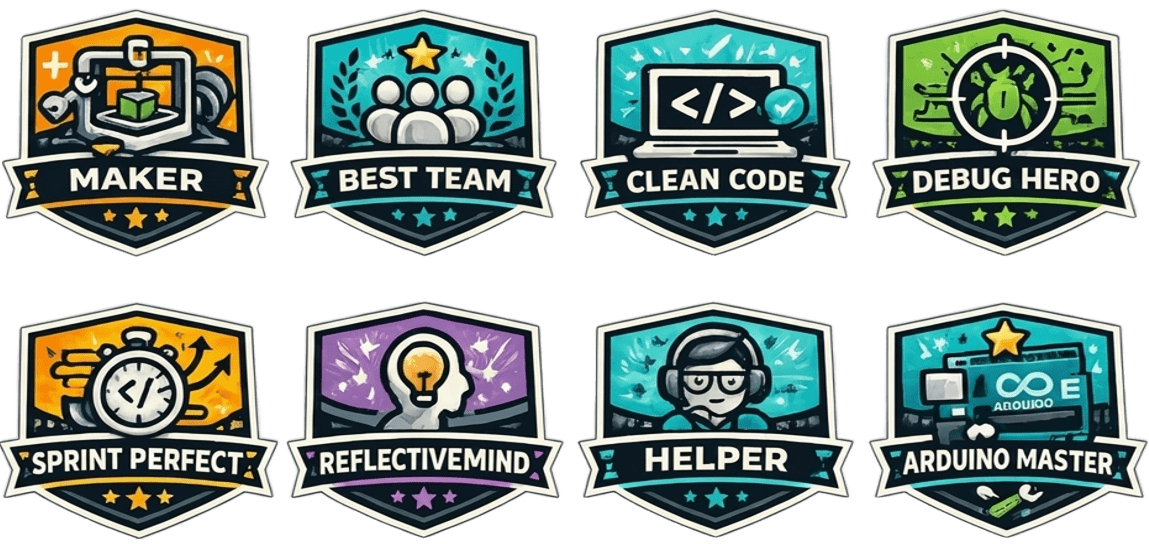
Figure 1. Badge set used in the Arduino PBL course.
A fixed catalogue of eight badges was used throughout the course: Maker, Best Team, Clean Code, Debug Hero, Sprint Perfect, Reflective Mind, Helper, and Arduino Master. Each badge could be awarded at most once per team. Six could be assigned whenever the relevant evidence was observed, whereas Sprint Perfect and Arduino Master were reserved for the last session. The maximum raw badge count per team was therefore eight, with no fixed per-sprint quota.
After each session, the instructor reviewed evidence from demos, teamwork, and brief documentation artefacts, and assigned badges when criteria were met. At the beginning of the next class, newly assigned badges were announced publicly together with the recipient teams and the reason they had been earned. Students also had access from the start to a table describing each badge and its minimum requirements.
3.2. Data and measures
We analyzed course records from the cohort with complete practical-grading information (N = 30 students; 15 teams). Because project work and badge assignment were team-based, both members of a team shared the same badge record; team-level analyses were repeated as a robustness check.
We distinguish between raw badge count and badge score. Raw badge count is the number of badges earned by a team (0–8). Badge score is the grading component obtained by the linear conversion Nbadges × (2/8), so badges contribute up to 2 points, i.e., 10% of the practical grade.
The practical grade followed the official rubric and was computed as the sum of four weighted components: badge score (0–2, 10%), Sprint 1 (0–4, 20%), Sprint 2 (0–4, 20%), and the final integrated prototype presentation (0–5, 50%). Hence, the final practical grade ranges from 0 to 10. In the analyses below, Sprint 1 and Sprint 2 are reported on their weighted 0–4 scales, badge score on its weighted 0–2 scale, and the final practical grade on the full 0–10 scale. Between-sprint progression was computed as ΔSprint = Sprint 2 minus Sprint 1.
All records were anonymized, and results are reported only in aggregate.
4. Results
This section summarizes the association between badge accumulation, sprint performance, and final practical grade through descriptive statistics, associations, group comparisons, and robustness checks.
Table 1. Illustrative snapshot of anonymized individual records (S01–S08).
ID |
Badge score |
S1 |
S2 |
ΔSprint |
Final |
S01 |
0.0 |
0.0 |
0.0 |
0.0 |
0.00 |
S02 |
0.0 |
0.0 |
2.4 |
+2.4 |
4.28 |
S03 |
0.5 |
3.2 |
1.6 |
−1.6 |
5.08 |
S04 |
0.5 |
2.4 |
4.0 |
+1.6 |
7.32 |
S05 |
1.0 |
2.4 |
4.0 |
+1.6 |
8.32 |
S06 |
1.0 |
4.0 |
4.0 |
0.0 |
8.80 |
S07 |
1.5 |
3.2 |
4.0 |
+0.8 |
9.36 |
S08 |
2.0 |
4.0 |
4.0 |
0.0 |
10.00 |
Table 1 illustrates the range of observed badge and performance patterns. Badge score is reported on the weighted 0–2 scale, Sprint 1 and Sprint 2 on weighted 0–4 scales, and Final on the full practical 0–10 scale.
Table 2. Descriptive statistics overall and by badge group (mean ± SD).
Metric |
Overall |
Low |
Mid |
High |
n |
30 |
14 |
8 |
8 |
Badge score |
0.85±0.59 |
0.32±0.25 |
1.00±0.00 |
1.62±0.23 |
S1 |
2.96±1.44 |
2.11±1.68 |
3.60±0.74 |
3.80±0.37 |
S2 |
3.44±1.01 |
2.91±1.28 |
3.80±0.37 |
4.00±0.00 |
ΔSprint |
0.48±1.43 |
0.80±1.96 |
0.20±0.93 |
0.20±0.37 |
Final |
7.56±2.16 |
5.92±2.16 |
8.60±0.20 |
9.36±0.68 |
We used non-parametric analyses because badge score is bounded and discrete. Associations with Sprint 1, Sprint 2, and final grade were assessed with Spearman correlations; badge groups were compared with Kruskal-Wallis tests. We also computed partial rank correlations controlling for Sprint 1 and Sprint 2, and repeated the analysis at team level.
Table 2 shows a clear gradient across badge groups. The sample mean badge score was 0.85/2 (SD = 0.59), with sprint means increasing from 2.96/4 in Sprint 1 to 3.44/4 in Sprint 2. The mean final practical grade was 7.56/10 (SD = 2.16).
|
|
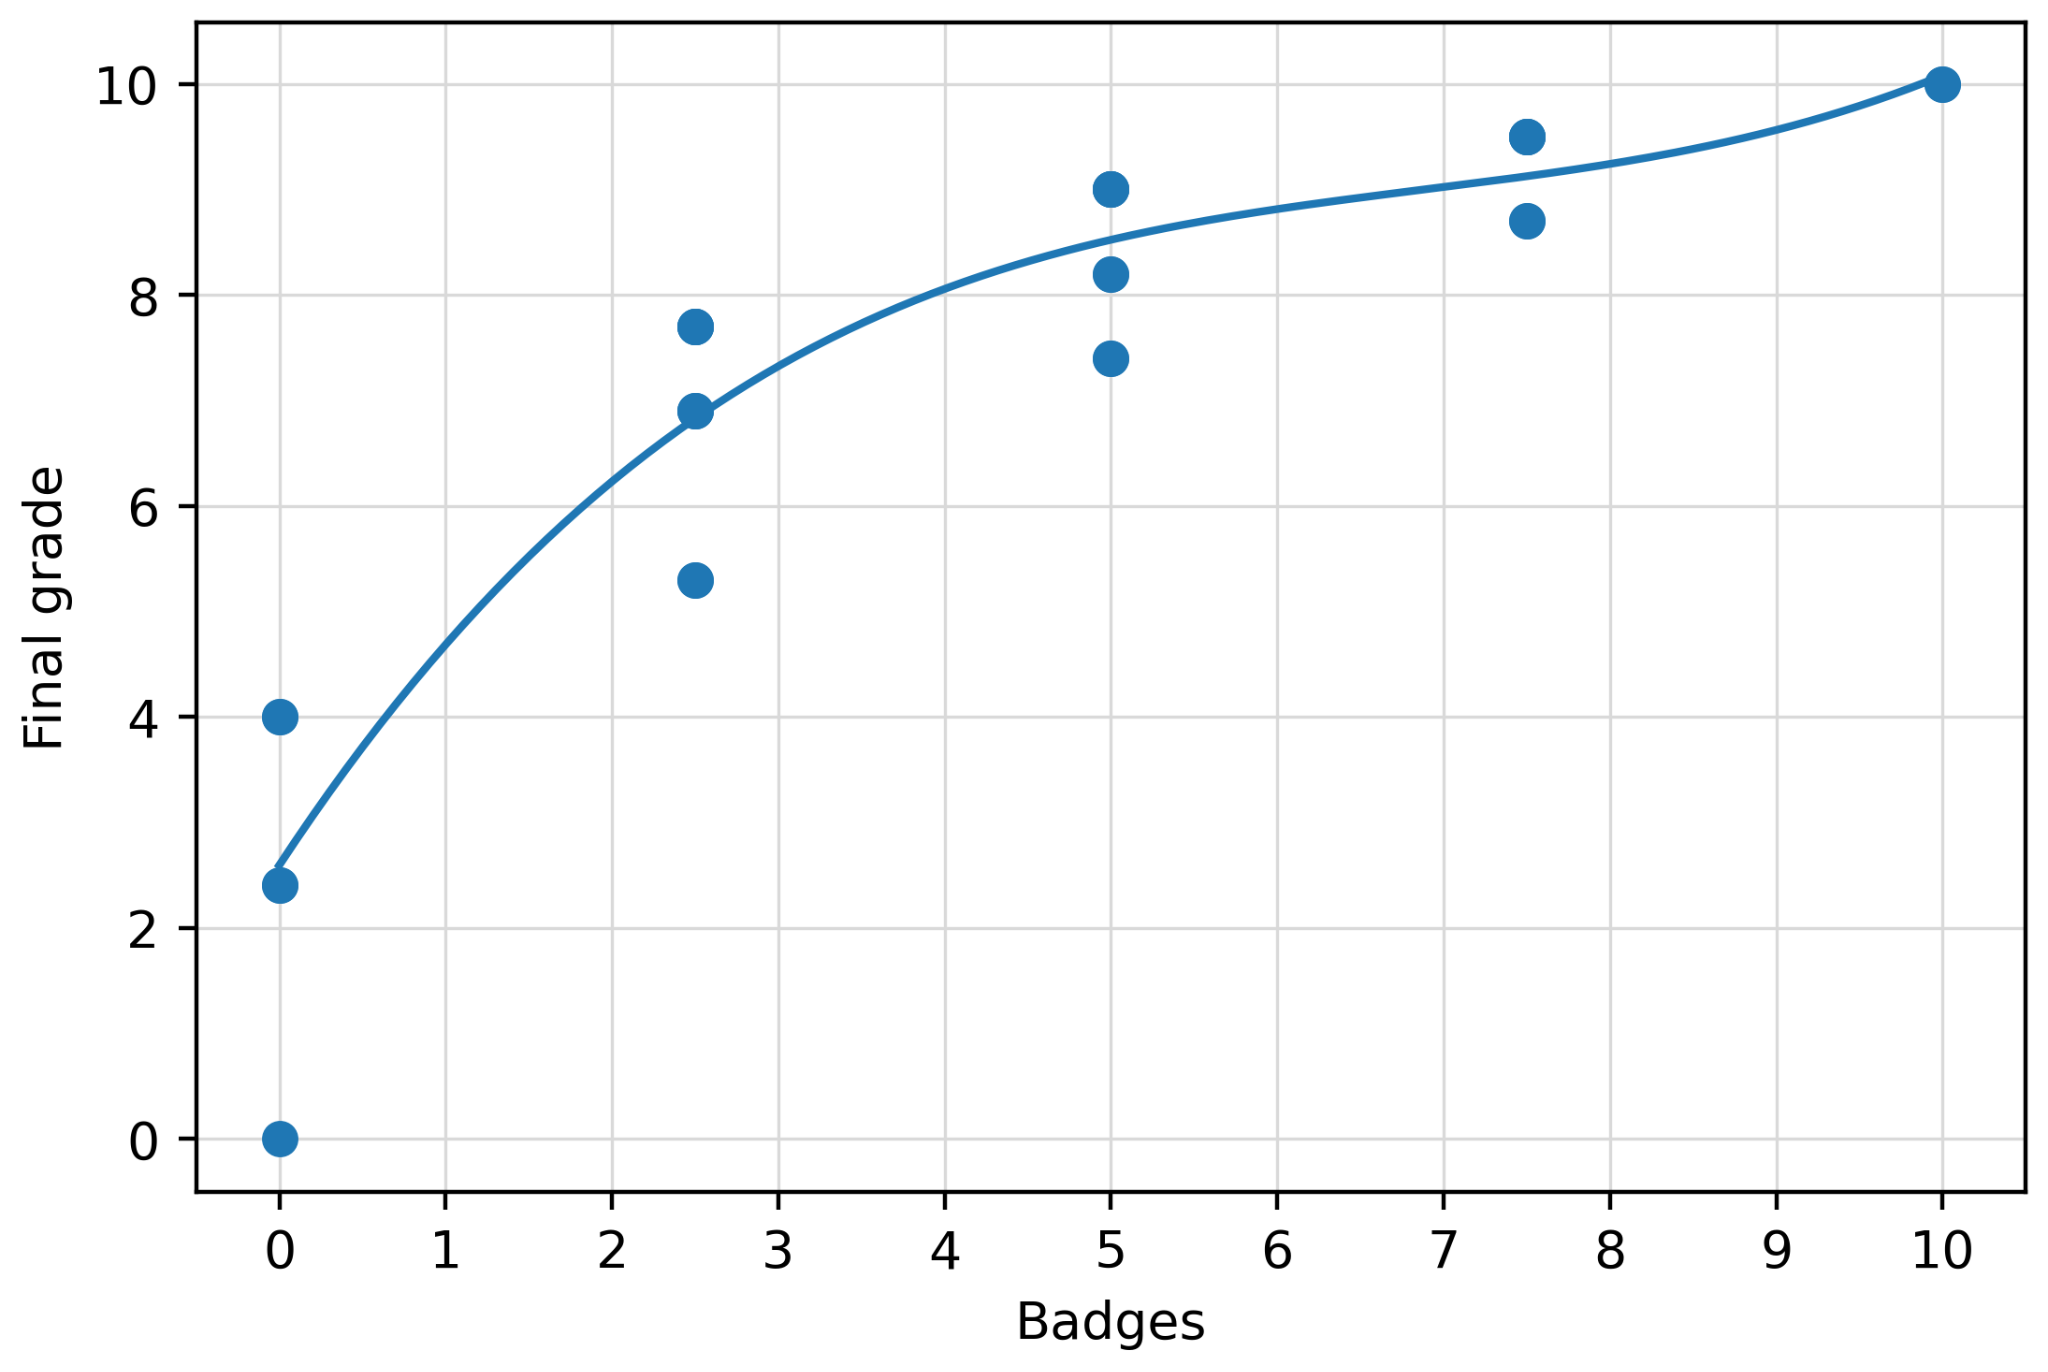
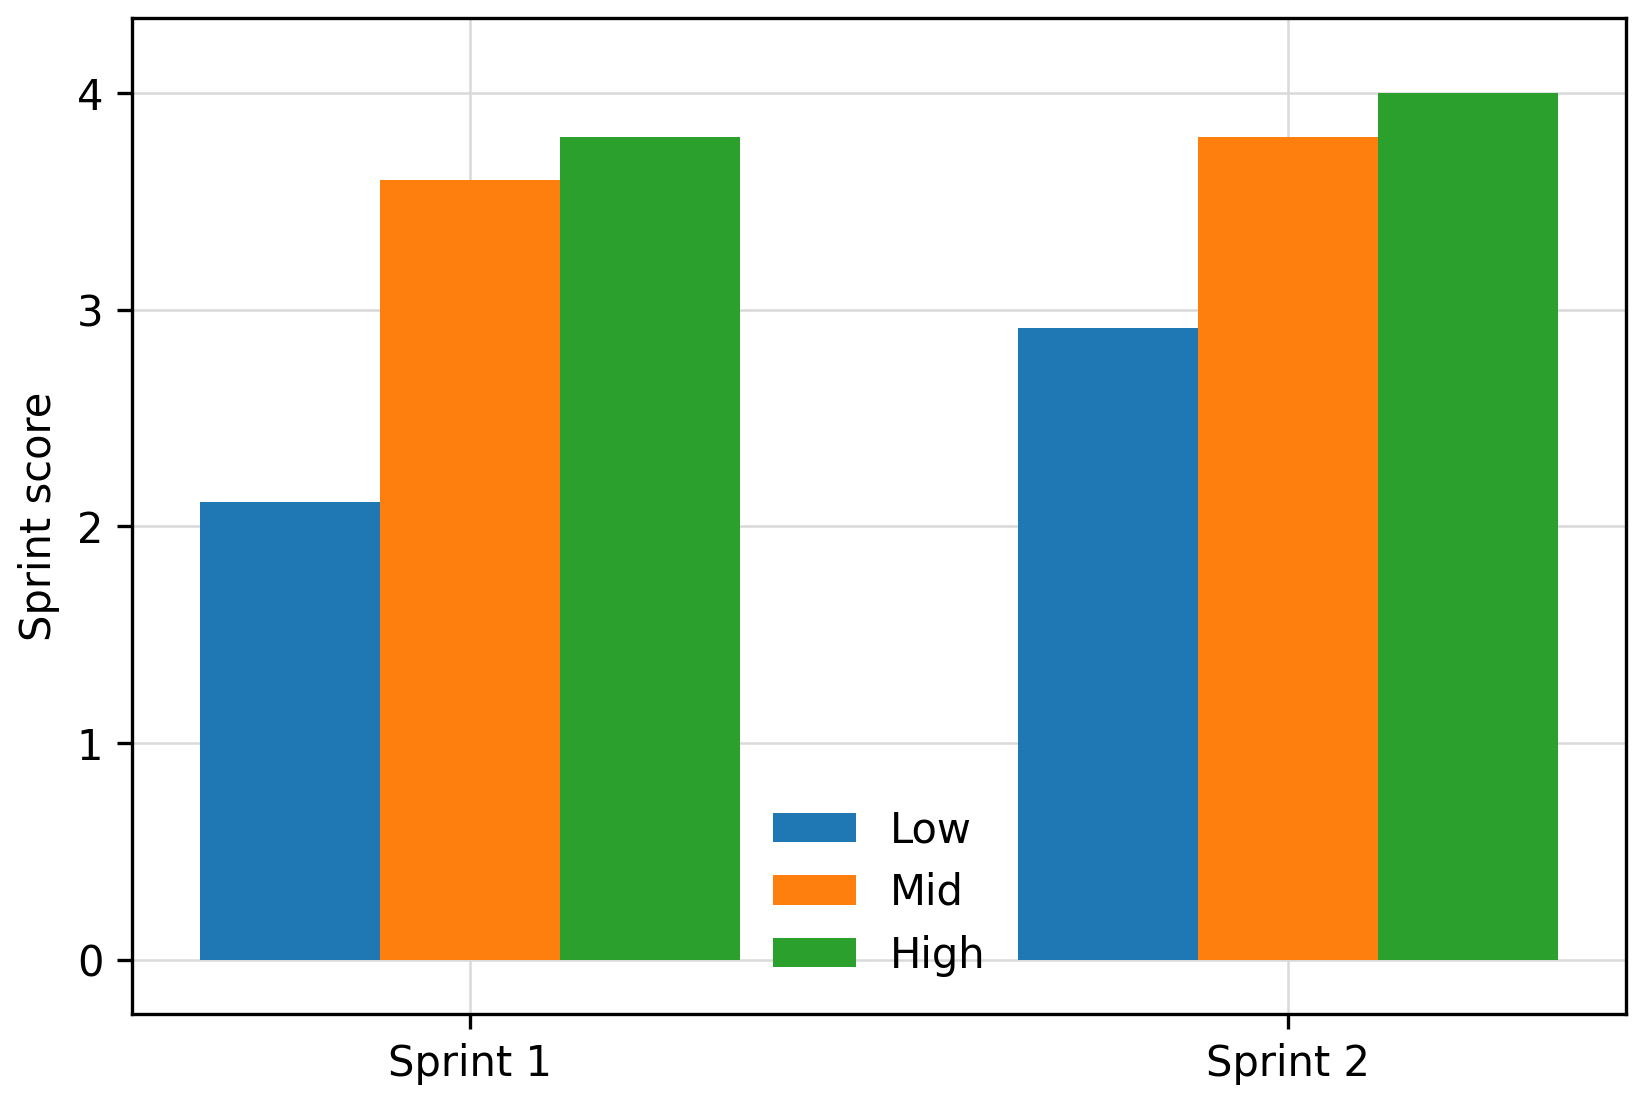
Figure 2. Left: badge component, displayed on a rescaled 0–10 horizontal axis, versus final practical grade. Right: between-sprint progression by badge group.
Badge accumulation was strongly associated with performance. Spearman correlations between badge score and Sprint 1, Sprint 2, and final grade were ρ = 0.69 (p < .001), ρ = 0.50 (p = .005), and ρ = 0.90 (p < .001), respectively. In the left panel of Figure 2, the x-axis is rescaled for readability: 10 corresponds to the maximum badge score of 2/2, i.e., all eight badges earned.
Badge groups also showed distinct performance levels. Mean Sprint 1 scores were 2.11, 3.60, and 3.80 for the Low, Mid, and High groups; Sprint 2 means were 2.91, 3.80, and 4.00; and final grade means were 5.92, 8.60, and 9.36. Group differences were significant for Sprint 1 (H = 10.64, p = .0049), Sprint 2 (H = 6.99, p = .030), and final grade (H = 22.57, p < .001). Although the Low group showed the largest average improvement between sprints (+0.80), differences in ΔSprint were not significant (p = .53). As shown in the right panel of Figure 2, badge groups mainly separate overall performance levels rather than improvement magnitude.
Badge score remained strongly related to final grade after accounting for early outcomes: ρpartial = 0.81 (p < .001) controlling for Sprint 1 and ρpartial = 0.87 (p < .001) controlling for Sprint 2. Team-level analyses (N = 15) were consistent with the student-level pattern: Sprint 1 (ρ = 0.67, p = .006), Sprint 2 (ρ = 0.42, p = .116), and final grade (ρ = 0.90, p < .001).
The strong badge–final association should nevertheless be interpreted cautiously. Because badges were part of the official practical rubric and aligned with the same process criteria that supported sprint and presentation performance, the relationship is best understood as evidence of strong alignment with broader practical achievement rather than as an isolated causal effect.
5. Discussion and Conclusions
This paper examined badges as visible formative feedback embedded in the weekly rhythm of an Arduino PBL course through a simple recognition loop: badges were awarded based on observable practices and announced at the beginning of the next session together with a brief explanation of why they had been earned. In one cohort (N = 30), badge scores showed strong monotonic associations with sprint performance and the final practical grade, and the badge groups separated students into distinct performance levels. These patterns are consistent with the idea that the badge routine made criteria visible in a way that students could act upon across successive sessions.
The main design contribution is the announcement routine as a lightweight way to make assessment criteria socially visible and actionable. In our teaching experience, the public explanation of the badges appeared to encourage emulation of good practices and a form of healthy competition between teams, which is coherent with a formative-feedback interpretation. At the same time, public visibility also invited peer comparison, so the educational value of the routine depended on presenting badges as signals of revisable practices rather than as fixed labels of student ability. This dual role is important for understanding why badges can simultaneously operate as formative guidance and motivational gamification.
Relative to learning-analytics interventions, which often rely on dashboards, trace data, or automated indicators to support feedback, the proposed routine is deliberately low-tech and instructor-curated (Banihashem et al., 2022). That simplicity may make it attractive in hands-on laboratories where rapid and situated judgement matters. Its cost, however, is that consistency depends strongly on the instructor and on students being present to display the relevant evidence. All teams had the same planned opportunities across the ten sessions, but absence could reduce the opportunities to demonstrate badge-worthy behaviour in a given class.
Limitations include the single-course observational design, the use of one cohort, and single-instructor badge assignment. Although the course had a previous edition without badges, that comparison was not analyzed here and remains a natural next step. Future work should therefore compare cohorts or sections, collect student-perception data more systematically, and examine whether the public badge-announcement routine produces effects beyond the alignment already built into the practical rubric.
Acknowledgement
The authors acknowledge the institutional support provided through this project and thank the students who participated in the Arduino PBL activities analyzed in this study, funded by the PIME educational innovation project PIME/25-26/537 and by Grant PID2024-158315NB-I00, supported by MICIU/AEI/10.13039/501100011033 and the European Union.
References
Banihashem, S. K., Noroozi, O., van Ginkel, S., Macfadyen, L. P., & Biemans, H. J. A. (2022). A systematic review of the role of learning analytics in enhancing feedback practices in higher education. Educational Research Review, 37, 100489. https://doi.org/10.1016/j.edurev.2022.100489
Chamorro-Atalaya, O., Morales-Romero, G., Trinidad-Loli, N., Caycho-Salas, B., Guía-Altamirano, T., Auqui-Ramos, E., Rocca-Carvajal, Y., Arones, M., Arevalo-Tuesta, J. A., & Gonzales-Huaytahuilca, R. (2023). Gamification in engineering education during COVID-19: A systematic review on design considerations and success factors in its implementation. International Journal of Learning, Teaching and Educational Research, 22(6), 301–327. https://doi.org/10.26803/ijlter.22.6.17
Hussain, A. A., Nayfeh, J., El-Nakla, S., Ifurong, A., Khan, A. H., & Tayem, N. (2024). Project-based learning approach for undergraduate electrical engineering laboratories: A case study. 2024 6th International Symposium on Advanced Electrical and Communication Technologies (ISAECT), 1–7. https://doi.org/10.1109/ISAECT64333.2024.10799876
Leitao, P., Piardi, L., Sakurada, L., & Mendes, A. (2023). Learning emergent digital technologies: The experience in the internet of things course unit. 2023 IEEE 21st International Conference on Industrial Informatics (INDIN), 1–6. https://doi.org/10.1109/INDIN51400.2023.10218278
Monteiro, R. H. B., de Almeida Souza, M. R., Bezerra Oliveira, S. R., dos Santos Portela, C., & de Cristo Lobato, C. E. (2021). The diversity of gamification evaluation in the software engineering education and industry: Trends, comparisons and gaps. arXiv:2102.05089. https://arxiv.org/abs/2102.05089
Nicol, D. J., & Macfarlane-Dick, D. (2006). Formative assessment and self-regulated learning: A model and seven principles of good feedback practice. Studies in Higher Education, 31(2), 199–218. https://doi.org/10.1080/03075070600572090
Pelizzari, F., & Ferrari, S. (2025). Utilising digital badges in higher education. A pilot case study analysing their influence on university students. Excellence and Innovation in Learning and Teaching - Open Access, 10(1). https://doi.org/10.3280/exioa1-2025oa20582
Soleymani, A., Aerts, T., de Laat, M., & Specht, M. (2024). Gamified networked learning environments in higher education: A study on student engagement and value creation in computer science. Proceedings of the 18th European Conference on Games Based Learning (ECGBL), 18(1), 755–765. https://doi.org/10.34190/ecgbl.18.1.2660
Vanitha, P., Masoodhu Banu, N. M. M., & Dhanaselvam, P. S. (2025). Productive learning: CDIO project based learning (PBL) assessment strategy for microcontroller course in engineering curriculum. Journal of Engineering Education Transformations, 39(1), 193–201. https://doi.org/10.16920/jeet/2025/v39i1/25124