How to turn a university park into a “living lab”: an experience with engineering students from the University of Trento
How to turn a university park into a “living lab”
How to turn a university park into a “living lab”: an experience with engineering students from the University of Trento
Maria Giulia
Cantiani1
 ,
Marco Ciolli1,2
,
Alba Dakaj1,
Paolo Zatelli1
1Department of Civil, Environmental and Mechanical Engineering, University of Trento, Trento, Italy, 2Center Agriculture Food Environment, University of Trento 38010 San Michele all’Adige, Italy.
How to cite: Cantiani, M. G.; Ciolli, M.; Dakaj, A.; Zatelli, P. (2026). How to turn a university park into a “living lab”: an experience with engineering students from the University of Trento. In: 12th International Conference on Higher Education Advances (HEAd’26). Valencia, 15-18 June 2026. https://doi.org/10.4995/HEAd26.2026.21612
This paper describes a multidisciplinary project carried out at the University of Trento, Italy, designed to valorize the faculty park through active student-teacher collaboration. Although the park holds significant historical and ecological value, it remained underutilized by the academic community. To bridge the gap between theoretical study and practical application, students from the Ecology course collaborated to characterize the local vegetation while students from the Numerical Cartography and GIS course mapped the sample points. Activities included botanical identification, tree height measurement, and the creation of vector maps through the georeferencing of analogic cartography. The project delivered a digital park inventory accessible via QR codes and successfully enhanced student engagement. This initiative demonstrates the effectiveness of using campus green spaces as "living labs" for environmental engineering, fostering essential professional skills while strengthening the community's connection to their environment.
Keywords: Engineering Education; Multidisciplinary Approach; Active Learning; GIS; Ecology; University Park.
1. Introduction
For local historical reasons, at the University of Trento the scientific and technical departments are located at the base of the mountain slope overlooking the city, while the other departments are all grouped downtown. The School of Engineering is found on a pleasant hill – Mesiano –where it extends over an area once used as a sanatorium. Both the main building and the surrounding park date back to the beginning of the last century. After the sanatorium closed and a long period of neglect, the main building was renovated in the 1980s to house the Faculty of Engineering. Over time, parking lots, laboratories, a canteen, and a library were built, but the green spaces were preserved. The trees grew in age and size. Many of the species present in the park today were planted when the sanatorium was built, following the tastes and beliefs of the time. Conifers were favored because they were believed to improve air quality; many exotic species were introduced, as well as native species, but from higher altitudes.
Mesiano Park has always been an important resource for the course of Ecology, taught in the second semester of the third year of the bachelor’s degree in Environmental engineering. From the beginning of the course, students are encouraged to take short walks outside the classroom to observe the phenological aspects of the vegetation, first in winter habitus and then with the changes that occur in spring. This is an excellent exercise for learning to observe. The ability to observe is an important yet often underestimated aptitude, indispensable for understanding phenomena and processes in the surrounding world (Walker, 2019). It must therefore be stimulated, especially in students who will have to deal with environmental problems in their professional future (Cantiani, 2019). However, students of technical and scientific disciplines in Italy have a strong theoretical background but often lack a concrete tie with the real world outside the Academia.
Given the curiosity and interest students have always shown in exploring the park, during the 2024-25 academic year it was decided to involve them even more. In fact, is has been proposed that they work together with teachers to deepen their knowledge of the vegetation and develop a project aimed at improving the use of the park by the entire Mesiano community. The project continued to develop during the first semester of the 2025-26 academic year, with third-year students of the course of Numerical Cartography and GIS, to approach the work from a multidisciplinary perspective.
2. The activities carried out in the park
Every day, the many individuals who study and work in Mesiano cross the 2.3-hectare park on their way to classrooms, laboratories or the library. Most of the time, people walk through the park inattentive and in a hurry, as if it were a faculty corridor. Only on some beautiful sunny days can you see small groups of students relaxing on the lawn or eating in the shade of the large trees; however, the park's potential is not well exploited.
Different activities were conducted during the ecology course to stimulate the students' interest in the park and its history and to create a bond with it. Among these, the planting of two cherry trees, a species which is not present in the park but is very widespread in the region, and the creation of a small vegetable garden, "the students’ garden". During the spring season, the students carried out the identification of all the tree specimens present (for a total of 28 different species) and created an analogic map based on the 1:2000 color vector map of the Municipality of Trento with the position of each tree (Figure 1).
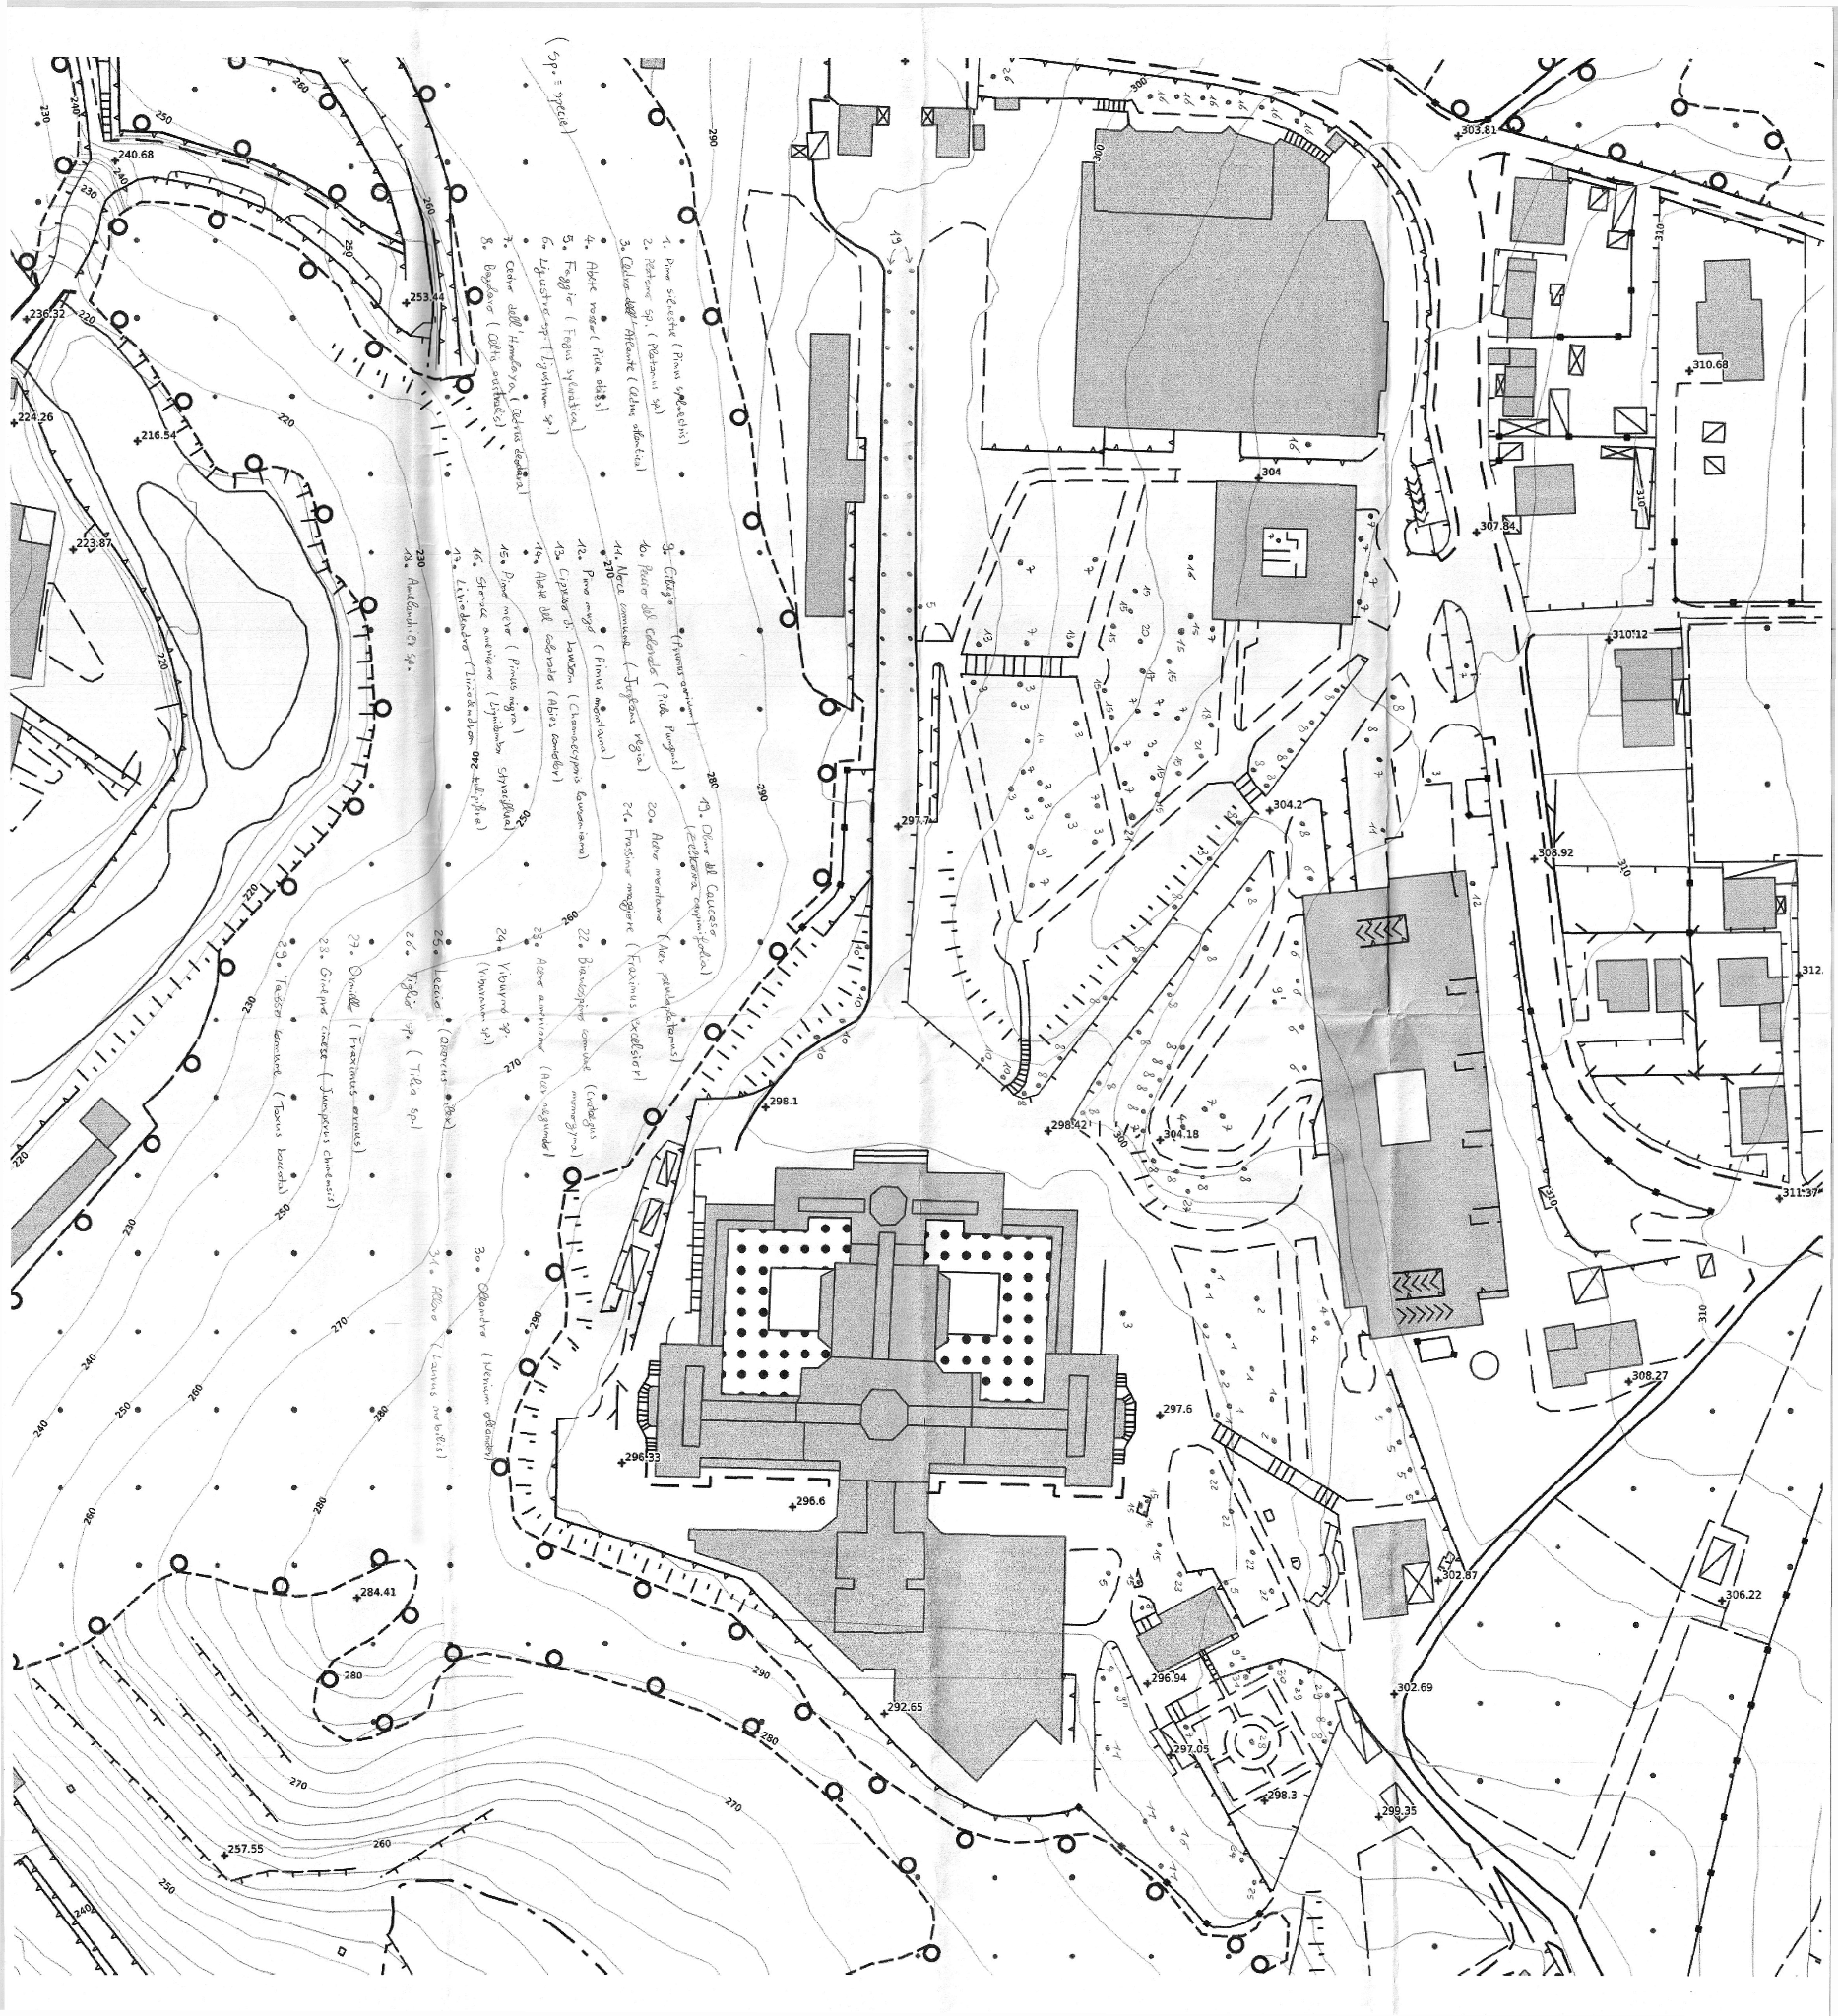
Figure 1. Original analogic (paper) map
The entire group of students attending the course was involved in this activity, working in small groups. Following this, some students volunteered to participate in a workshop, with the aim of creating a descriptive card of the morphological and ecological characteristics of the park's trees. Each participant chose his or her own tree (one specimen for each species), studied the literature, discussed it with the teachers, measured the dimensions of the plant in the field and made an accurate description of it. All relevant information was then summarized in the technical card (see an example in Figure 2).
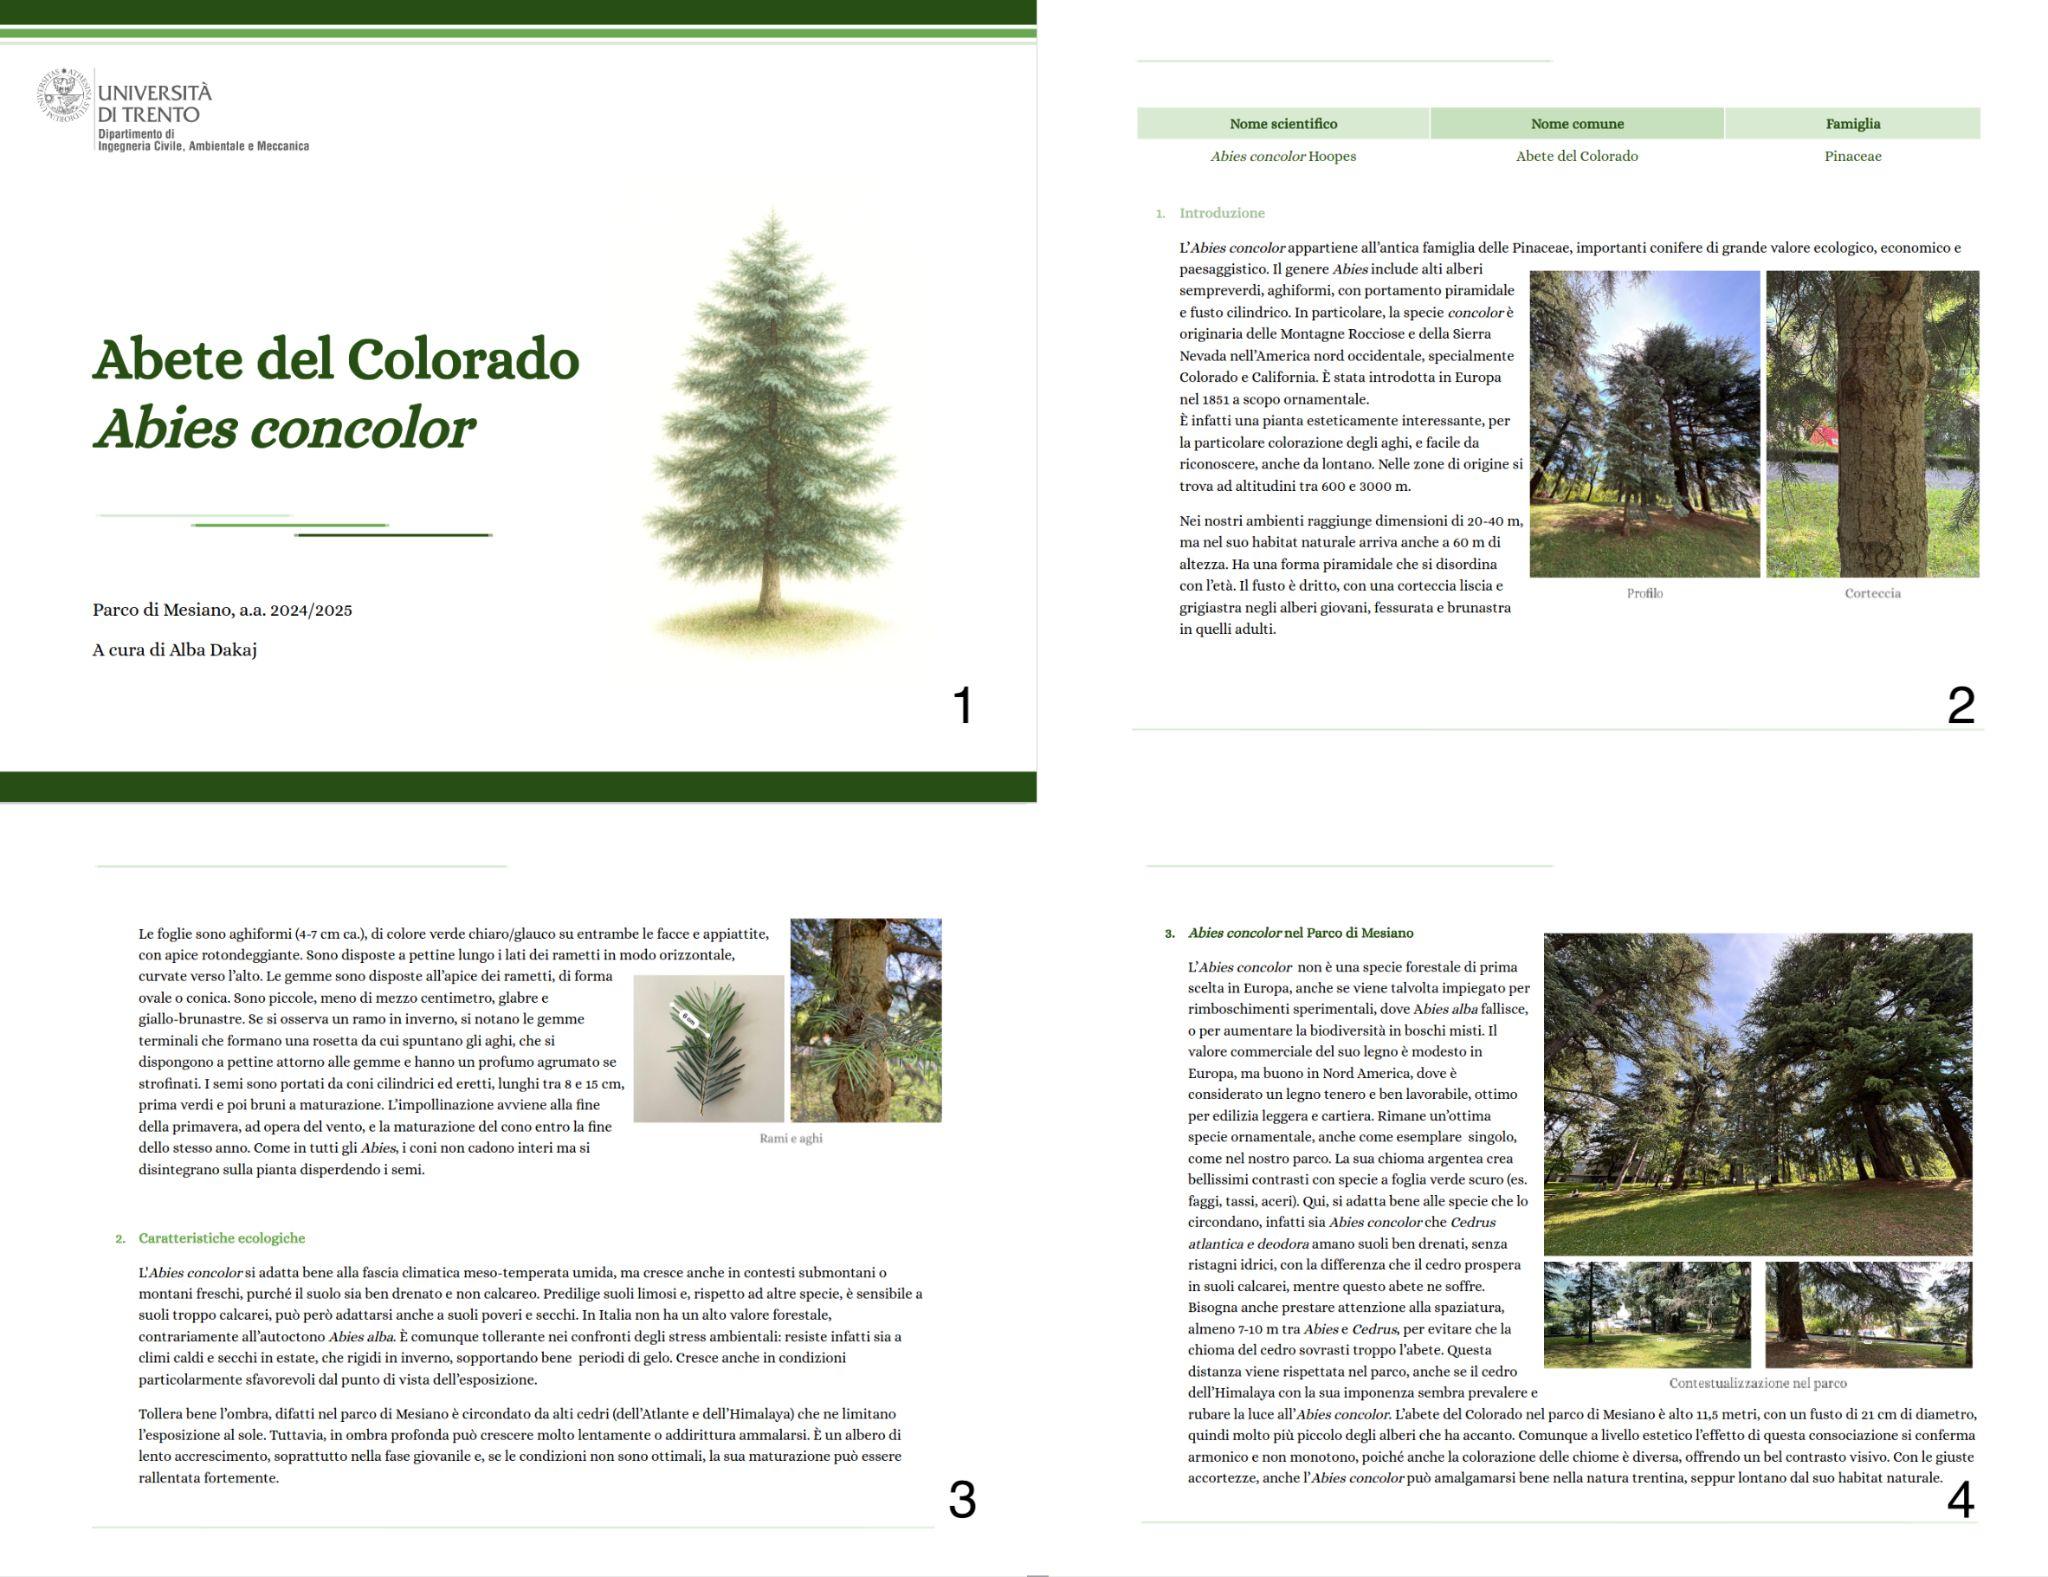
Figure 2. Technical card that summarizes all the relevant information for Abies concolor
A QR code printed on a picket, placed at the foot of the tree, allows access to the card and the connection to the digital map, created later by a group of students from the course of Numerical Cartography and GIS.
3. Digital map
Analogic (paper) maps, while useful for some tasks, such as field operations and group discussion, have a limited use with respect to their digital versions. Therefore, a group of students have been tasked to geo-reference the digital scan of the paper map and to transform the points indicating the plants’ positions into a vector map. All the cartographic operations have been carried out using QGIS (QGIS Development Team, 2026), a free and open source software which is an excellent tool for geospatial education (Ciolli et al., 2017). Geo-referencing assigns coordinates in a cartographic reference system and projection to the elements in the map, allowing the combination of the map with any other available map layer. The transformation into vector features provides the possibility to associate to each point information in a table.
3.1. Geo-referentiation
The geo-referentiation process has been carried out using QGIS’ Georeferencer tool. The same map used as the background on the paper map has been used as a reference map, using the Web Map Service (WMS) service provided by the Municipality of Trento (Comune di Trento, 2026) in the European ETRS89 / UTM zone 32N, EPSG 25832 (a unique identifier for this coordinate reference system), datum. Since the paper and the reference maps have the same datum (they are, in fact, the same map) a 2D Halmert transformation has been used (Bozzano et al., 2024) using 12 Ground Control Points (24 equations).
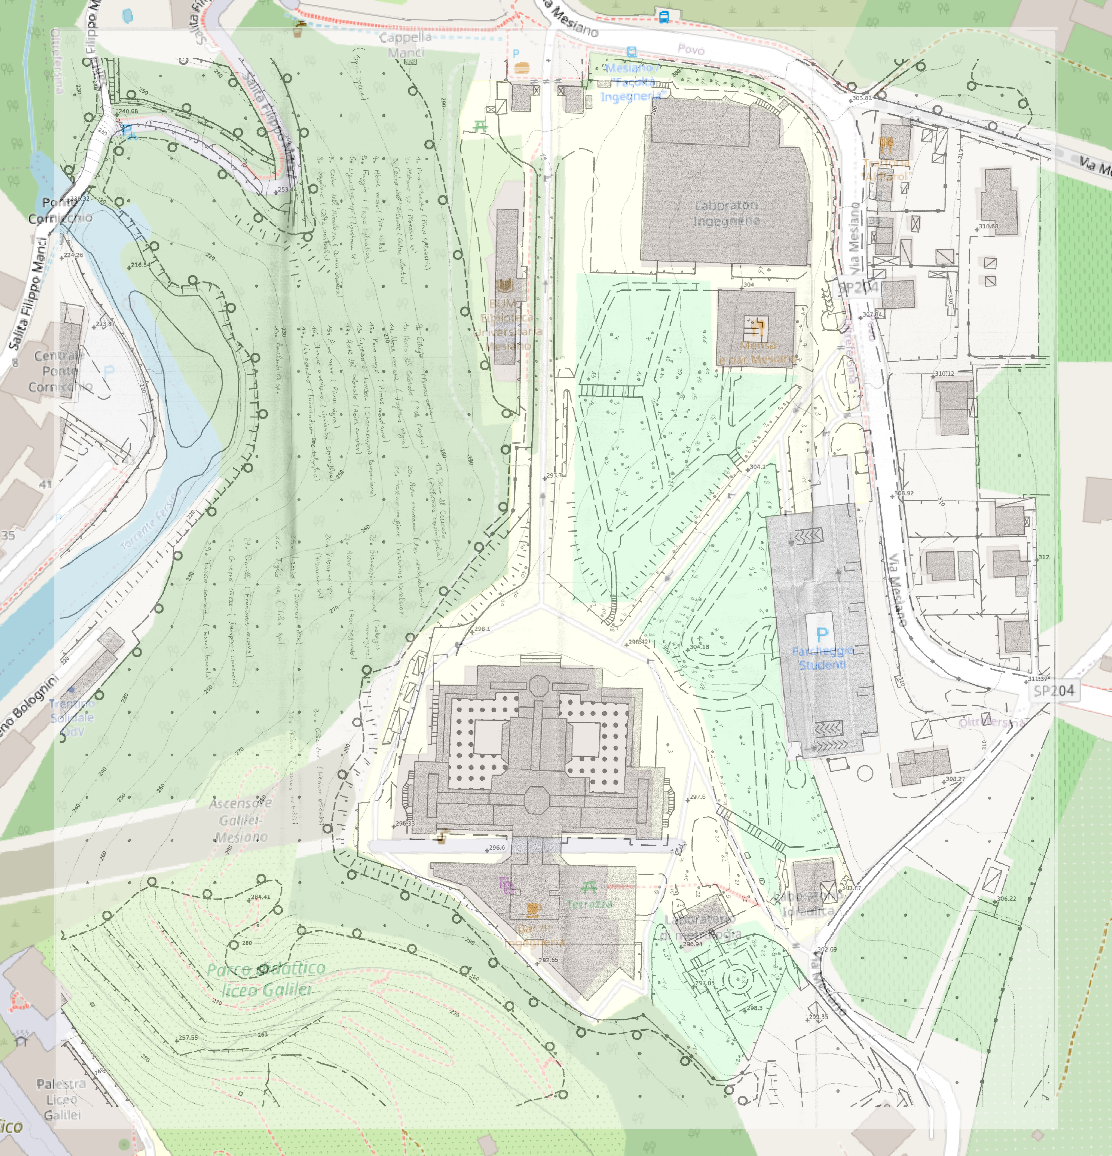
Figure 3. Geo-referenced map superimposed to the original base map
The output of the procedure is a map with the correct coordinates in the ETRS89 / UTM zone 32N, EPSG 25832, datum (Figure 3). The resulting transformation has a Root Mean Squared Error (RMSE) of 0.210m, consistent with the 1:2000 scale of the base map, with an average residual of 0.15m and a maximum of 0.36m.
3.2. Vectorialization
Points indicating the plants’ positions in the geo-referenced map in Figure 3 are in the correct position but, since they are in raster format, it is not possible to associate to the points any information. At first the students proposed to use an automatic marker extraction tool, Historical Occurrence Georeferencing System (HOGS) (Ravenscroft, 2025), but without success. Thus, each point has been digitized manually in QGIS. A new vector map has been created with 185 points, each with a unique identifier and a code indicating the plant species (Figure 4).
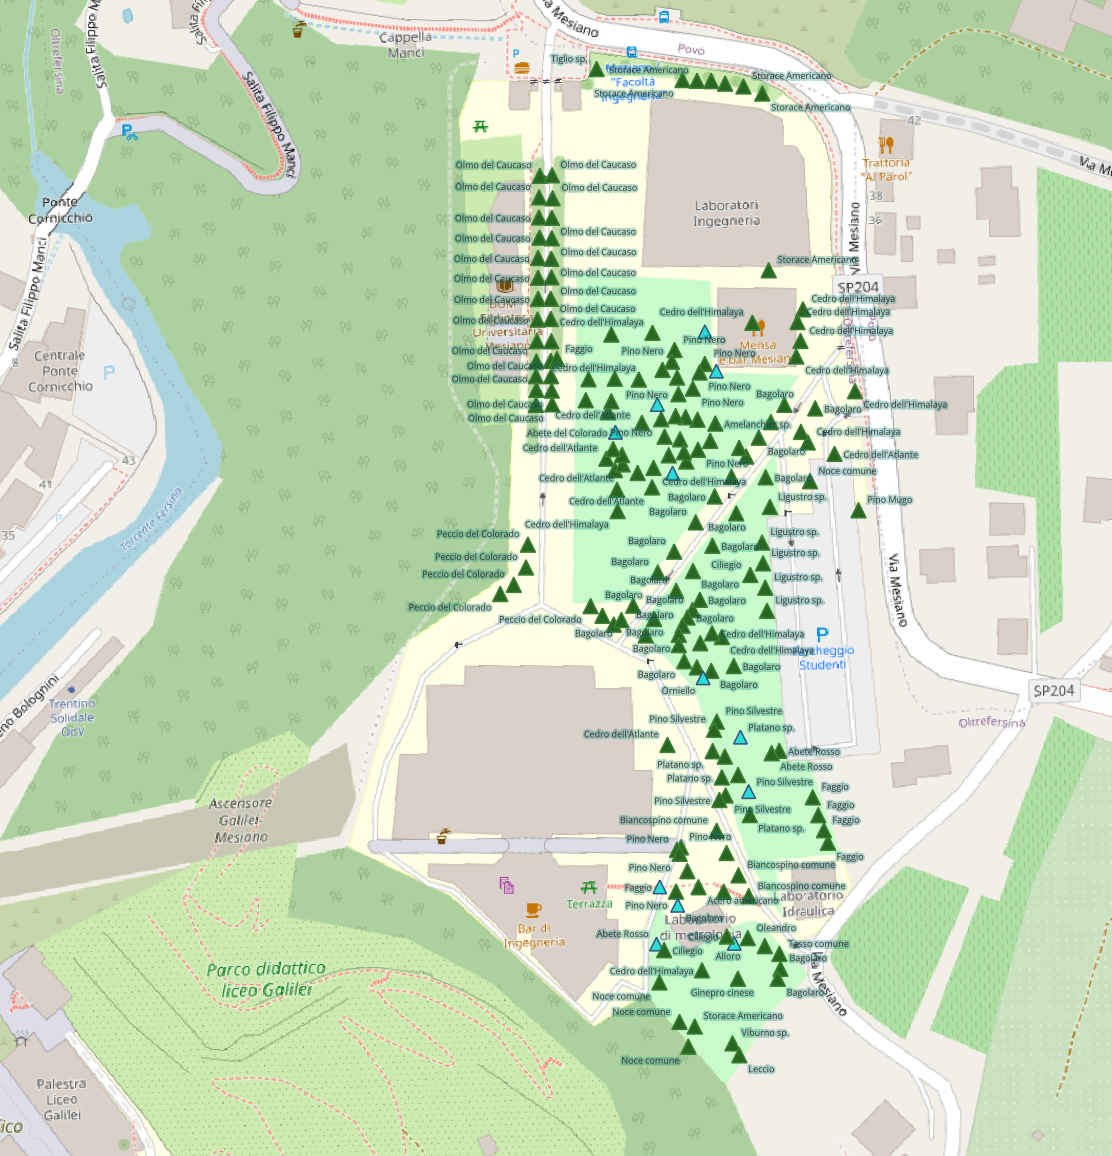
Figure 4. Point map: green triangles indicate the position of each plant; blue triangles indicate plants associated with a card
A table has been created for each species containing its code, Italian name, Latin name and family. A table join has automatically associated this information to each plant.
4. Tree height measurement
As an additional exercise, students were asked to measure the height of a sample of trees (Figure 5). They were trained on the use of hypsometers, instruments used to measure trees height, that use trigonometric principles to calculate height based on the measurement of angles and distances. Various forms are available, including traditional optical devices and advanced laser techniques and the students were trained on different models. For the final measure they decided to use a laser rangefinder which allows to measure the trees from a distance range of 7.5-1.600 m, with a 0.1 m resolution, and a maximum angle of 89.0°, with 0.1° resolution (Nikon Forestry Pro II). Actually, its use was more intuitive for our students.
The measures were carried out trying to optimize the distance from the stem and the visibility of the top of the tree. The operative condition of the park was very simple, since all the areas were easy to walk and the terrain roughness was extremely low (Chioni et al. 2023). Once the students were trained with the hypsometer, they started collecting the data, repeated the measure 5 times for each tree and calculated the mean value.
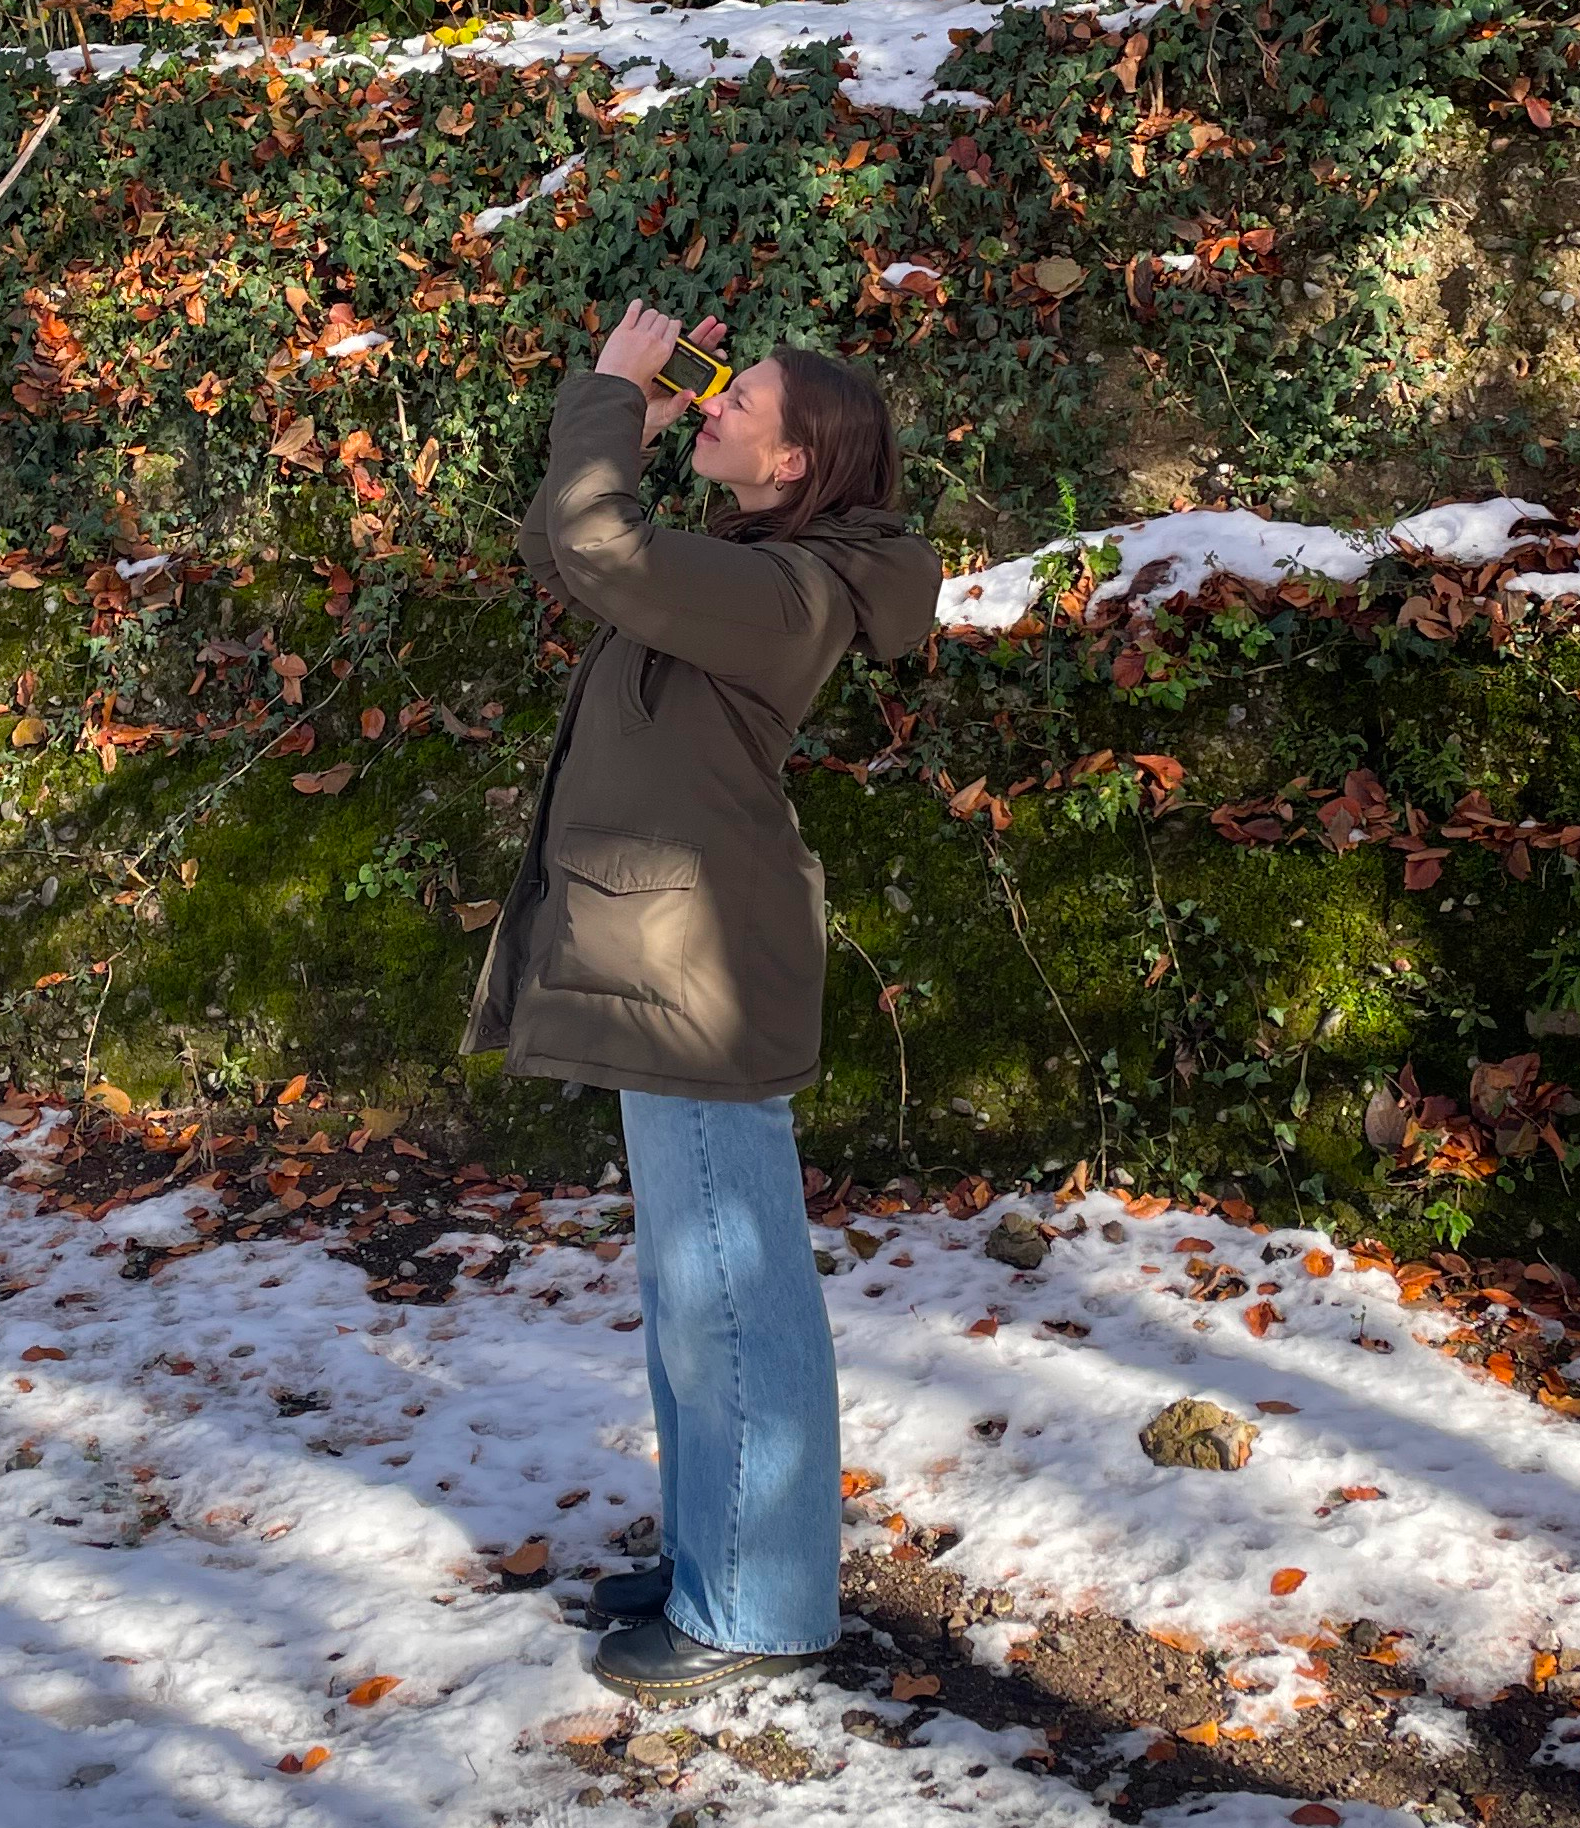
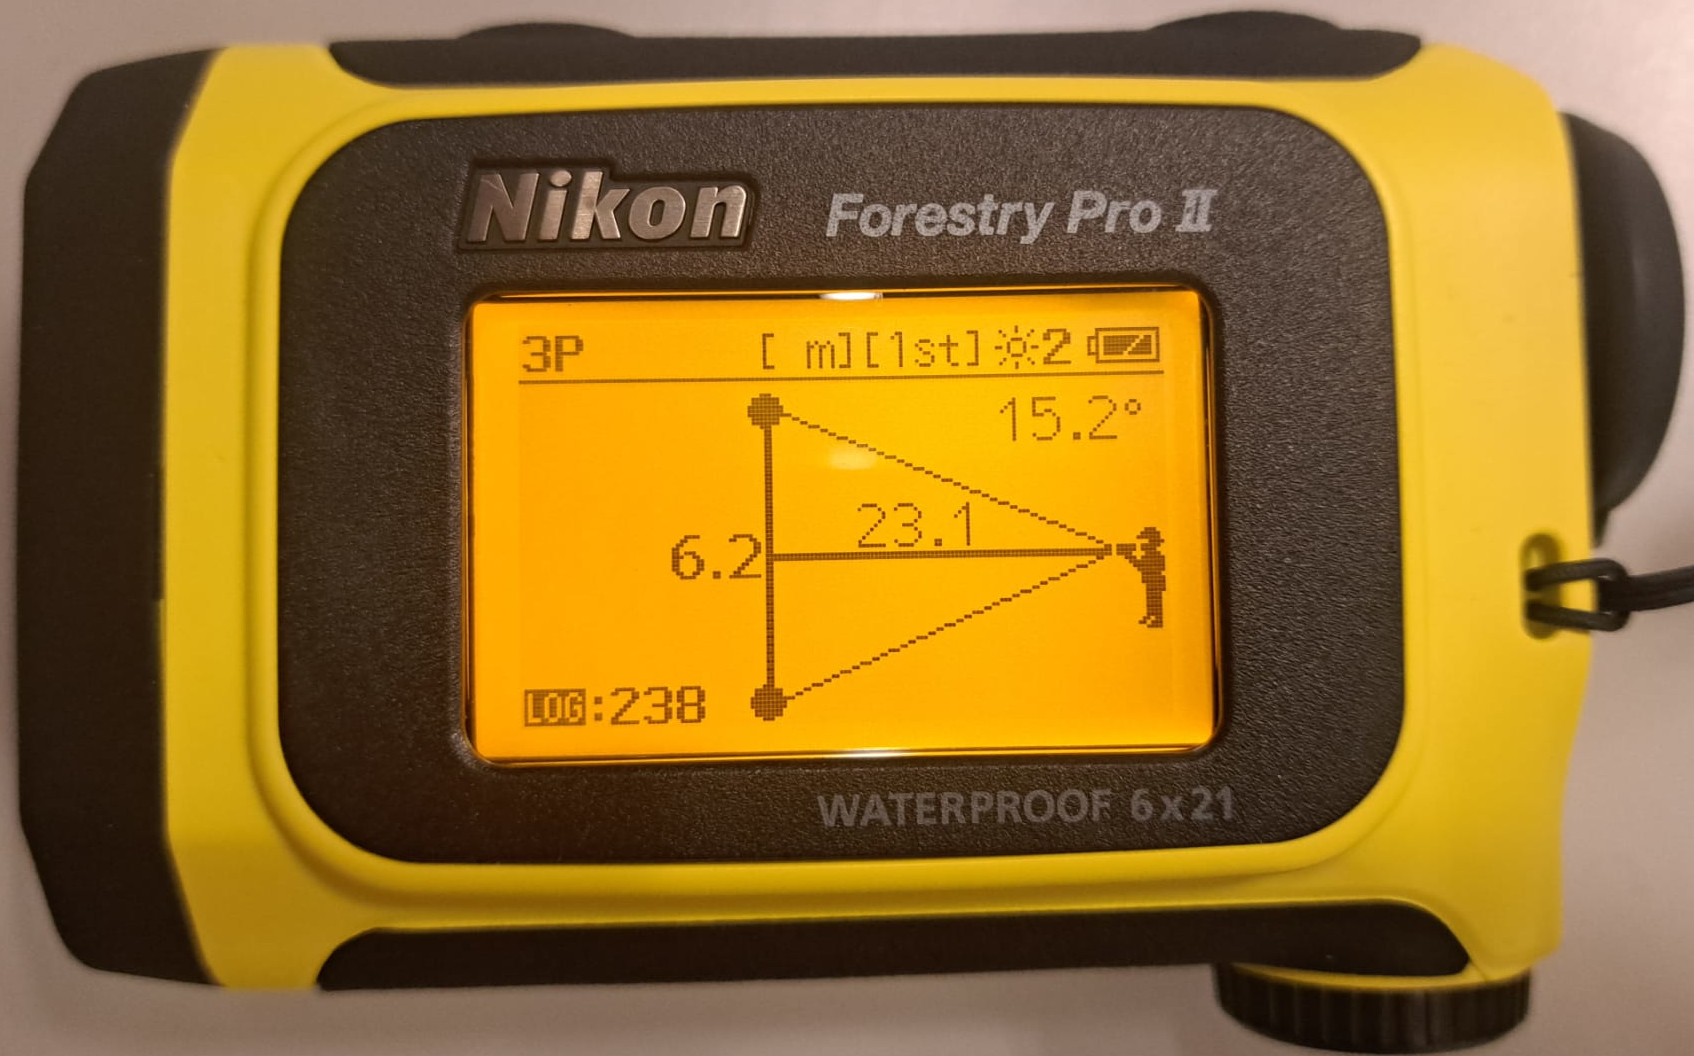
Figure 5. A student measuring tree height with a hypsometer in Mesiano Park
The data were collected using standard dendrometric techniques and recorded on a specially prepared field data sheet.
This type of survey, which is obvious for any forestry science student, has aroused the curiosity of our engineering students, who found it interesting and enjoyable.
5. Canopy evaluation from LiDAR
Having the actual measurements of the heights of the trees, the students tested whether it is possible to evaluate the canopy height with reasonable accuracy using the available Light Detection and Ranging (LiDAR) data. Datasets for two years are available: Digital Terrain Model (DTM, a map containing the altitude of the terrain) and Digital Surface Model (DSM, containing the altitude of the objects, such as buildings and vegetation, above the terrain) from a 2009 survey, with 1m resolution, and DTM, DSM first (impulse) and DSM last (impulse) for 2014, with 0.5m resolution. DSM first represents the surface evaluated from the first received return signal, therefore representing the tallest objects in the area, while DSM last is created with the last received impulse, therefore ideally representing the ground surface or at least the objects below the canopy.
Canopy height has been therefore evaluated for 2009 simply as DSM 2009 – DTM 2009, while for 2014 the DSM 2014 first – DTM 2014 and DSM 2014 first – DSM 2014 last have been tested. These values have been sampled at each plant location, and their values have been added in new columns in the table, together with the measured height when available. One obvious observation to this approach is that the DTM and DSM datasets are 16 and 11 years old, therefore the comparison with current measurements must consider the time passed in terms of canopy height growth.
The differences between evaluated and measured plants’ height vary from 2 meters to more than 20 meters. While the first case can be justified by the plant growth in more than 10 years, this cannot explain the higher values. The students’ analysis has pointed out that in many cases the problem is due to an incorrect planimetric position of the plant, which in some cases can be misplaced by more than 5 meters. Manually correcting the position on the map using the orthophoto brings the height difference back in the 2m range.
6. Conclusions
Thanks to the project, students learned to work together, interacting constructively with teachers, and this created a spirit of collaboration to achieve common goals. They had to tackle new problems with a multidisciplinary perspective, using tools familiar to environmental engineers as well as tools from other fields. They attempted to solve concrete problems, drawing on their theoretical knowledge. It was an excellent exercise, and the students demonstrated interest, commitment, and creativity. Their activity, somewhat unusual compared to traditional ones, also piqued the curiosity and attention of students from other years and other courses of study, raising expectations among younger students who had yet to enroll in their third year.
The project will continue to develop over the years, possibly involving other disciplines as well. Not all species have a tree with its technical card yet and this work will be carried out next semester; work on the webGIS design will be necessary. With the help of a teacher in hydraulics, a rainwater collection system will be planned to irrigate the students' vegetable garden. In the next semester, second year students in the Surveying course will be tasked to determine the plants’ positions with decimeter accuracy using Global Navigation Satellite System (GNSS) with the Real Time Kinematic (RTK) technique. Areas of the park will be identified for different uses (relaxation, study, sports, etc.), to be equipped with lightweight infrastructure. A WebGIS for the exploration of the map and all the plants’ information collected by the students will be published at parcomesiano.dicam.unitn.it in the next months.
The goal is to gradually transform the park into something that belongs to the Mesiano community, to be known, respected, and cared for. A park to be experienced and lived in, becoming part of each one’s identity, and of which people can say: "It's wonderful to study and work in Mesiano!"
Acknowledgements
The authors would like to thank the students participating in the project: Chiara Permunian, Sara Percacini, Jacopo Orti Manara, Luca Accordini (map geo-referencing and digitalization, canopy height evaluation); the whole 2025 class of the Ecology course (analogic mapping); Thomas Adami, Alba Dakaj, Alice Feltrin, Serena Fratton, Lorenzo Ghiloni, Gabriele Leo, Elisa Menin, Michele Merz, Marco Oltolini, Ilaria Salustri, Gabriele Sandri, Mattia Valentini, Sara Vedovelli (technical cards).
References
Bozzano, M.; Sguerso, D.; Zatelli, P.; Zendri, D.; Besana, A. (2024). Accuracy Evaluation for Plan-Reliefs and Historical Maps Created during WWI in Northern Italy. ISPRS International Journal of Geo-Information, 13(3), 101. https://doi.org/10.3390/ijgi13030101
Cantiani, M. G. (2019). How to Teach Ecology to Students of Environmental Engineering. 5th International Conference on Higher Education Advances (HEAd’19), 703-710. http://dx.doi.org/10.4995/HEAd19.2019.9124
Chioni, C.; Maragno, A.; Pianegonda A.; Ciolli, M.; Favargiotti, S.; Massari, G. A. (2023). Low-Cost 3D Virtual and Dynamic Reconstruction Approach for Urban Forests: The Mesiano University Park. Sustainability, 15(19), art no 14072. https://doi.org/10.3390/su151914072
Ciolli, M.; Federici, B.; Ferrando, I.; Marzocchi, R.; Sguerso, D.; Tattoni, C.; Vitti, A.; Zatelli, P. (2017). FOSS Tools and Applications for Education in Geospatial Sciences. ISPRS International Journal of Geo-Information, 6(7), 225. https://doi.org/10.3390/ijgi6070225
Comune di Trento (2026). Web Map Service (WMS) e Web Feature Service (WFS) conformi allo standard Open Geospatial Consortium (OGC). https://gis.comune.trento.it/ogc (visited on 20/1/2026).
QGIS Development Team (2026). QGIS Geographic Information System. Open Source Geospatial Foundation Project. http://qgis.osgeo.org (visited on 20/1/2026).
Ravenscroft, H.; Gardner, J.; Perktas, U.; Saupe, E. E. (2025). Release the HOGS: An unsupervised marker extraction, classification and georeferencing approach for biodiversity data. Methods in Ecology and Evolution, 16, 2552–2559. https://doi.org/10.1111/2041-210X.70166
Walker, R. (2019). The art of noticing. New York: Alfred A. Knopf