Social Selectivity, School Belonging and Performance
Social Selectivity, School Belonging and Perfomance
Social Selectivity, School Belonging and Performance
Marcel Verhoeven
 ,
Susan Goeldi
School of Business, University of Applied Sciences, Northwestern, Switzerland.
How to cite: Verhoeven, M.; Goeldi, S. (2026). Social Selectivity, School Belonging and Performance. In: 12th International Conference on Higher Education Advances (HEAd’26). Valencia, 15-18 June 2026. https://doi.org/10.4995/HEAd26.2026.21676
Abstract
Universities of applied sciences across Europe attract a socially diverse student body. This study examines the relationship between socio demographic characteristics, learning factors, and academic performance at the School of Business FHNW. Using in-depth interviews with a structured sample of 38 students. The findings highlight the need for HEIs to better include female students from lower social classes and migrant histories. Recommended measures include expanding support structures such as counselling, peer tutoring, and mentoring; and fostering a more diverse faculty
Keywords: Socio Economical Selectivity, School Belonging, Student Performance, Inclusion measures, Diversity management HEI.
1. Introduction
Educational achievements in higher education are unequally distributed across social groups as lower social strata perform significantly worse in terms of study/life satisfaction (Allen et al., 2021), show poorer grades, academic achievements, and social integration at universities (Rubin et al., 2014), and drop out more frequently (Atherwood & Sánchez-Soto, 2023; Herbaut, 2021). Subsequent life trajectories can easily be predicted based on non-performance-related criteria such as social background, migration status, or gender (Becker & Schoch, 2018).
In this study, we explore the form, character, and significance of the problem of social selectivity at the University of Applied Sciences Northwestern Switzerland (FHNW) through interviews with students. Additionally, evidence-based and interviewee-evaluated solutions are suggested. The aim of the research is to assess the specific problems at the university and applicable measures to address it.
2. Relevant Research
Gender, ethnicity, and social class are generally identified as underlying factors in the emergence and perpetuation of social divisions (Giddens et al., 2009; Grusky, 2019; Mills 2019). Definitions of class vary, but it is widely understood as “one’s position within a social structure of unequal access to available resources (material, social, political)” (Deery & Press, 2018, p. 3). Bourdieu emphasizes cultural assets as critical to class stratification (Stopforth & Gayle, 2022).
The sense of School Belonging, described as the psychological sense of being accepted, valued, and supported within the academic community, is critical as it influences students' emotional engagement, academic performance, persistence, and overall satisfaction with their educational experience (Strayhorn, 2018, Tinto, 1993). When students feel they belong, they are more likely to participate actively in their educational environment, leading to improved graduation rates and retention. Conversely, a lack of belonging can lead to feelings of isolation, disengagement, and ultimately, higher dropout rates. Educational disadvantage, "social" ethnicity, and subjective social status influence socio-emotional experiences. Students from lower social classes exhibit a lower sense of School Belonging, which is associated with negative psychosocial and lower performance outcomes (Langhout et al., 2009; Allan et al., 2023; Brown and Papp, 2025).
3. Concepts and Methodology
3.1. Research Design
The in Figure 1 depicted concepts are adopted from various (aforementioned) sources, operationalized and deployed in the analysis. Quantification for analysis bases on the sentiment, vehemence and frequency of statements, and consists of assigning values of 1 lowest, to 6 highest on an ordinal scale (for most indicators), respectively 1 or 2 on a dichotomous nominal scale (for gender, and (non-) migration history).
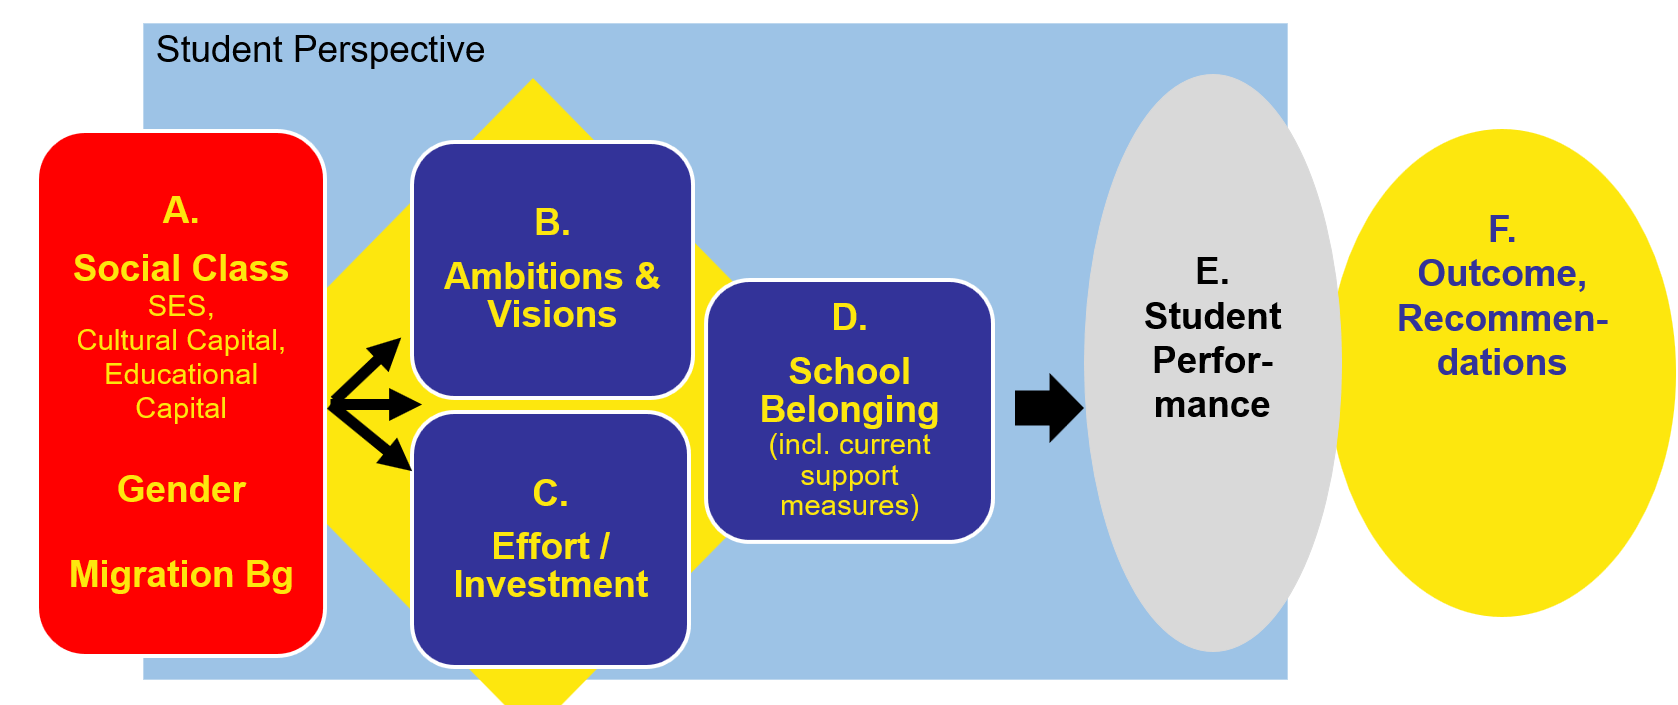
Figure 1. Research Design1
Indicator (A) Characteristics of respondents: Social-economic status (SES), cultural capital, educational background/capital (“1st generation”2), and self-assigned social class contribute to the qualification of a specific social class. The qualifications of (non-) migration history and gender were self-assigned by the interviewee. The SES bases on respondents’ descriptions of family property, previous and current living circumstances, material assets, consumption patterns etc. Cultural capital is established by surveying the extent of involvement in creating and/or consuming of high- and pop-cultural products by a) respondents, and b) family. Educational capital is established by surveying the education (type, level) of the respondents’ immediate and wider family as well as the salient validation of education achievements in familial circles. Subjective social class is self-assigned by respondents.
Indicator (B) Ambition & Vision: Statements on ambitions, goals, visions, motivation, references to mid- and long-term objectives such as social mobility, general personal and/or career development are compiled and an index value per respondent is assigned on the six-point scale. In a separate analysis, the entrepreneurial ambition (own company, one-man firm, independence) is scored on the six-point scale.
Indicator (C) Investments, Efforts: Statements on absolute and comparative efforts and invested resources for studying (mainly time and energy, absolute and relative to peers) are compiled and an index value per respondent is assigned on the respective six-point scale.
Indicator (D) School Belonging: University belonging includes the qualitatively investigated facets social and academic integration; institutional fit: safety and support, as well as emergent indicators. Statements on a) a wide spectrum of School Belonging- and wellbeing-related experiences, perceived progress, developments, challenges, problems, support, opportunities, or more systematically formulated, on.; b) perceived return of investment in study; and c) perceived collision between study and employment demands, are compiled and a six-point scale index value is assigned for the three sub-indicators per respondent.
Effect (E) Student performance: Performance of the respondents is assumed to be an effect, a result of the indicators (A) to (D). It is measured by the self-reported current average mark, range 1 (lowest) to 6 (highest mark). Since all respondents were during the study’s field time enlisted in the university, their average mark will be at least sufficient (>3.5).
3.2. Data collection, Sample, Analysis Method
For data collection, 38 students at the School of Business FHNW were interviewed in in-depth interviews (50-90 minutes) based on semi-structured questionnaires. To investigate the described phenomena, recruited for interviews were subjects with potential / assumed migration history, female identity and / or lower-class background. To enable comparisons, respondents apparently not fulfilling these characteristics were recruited. Non-migrant history, male and/or middle- and higher-class subjects were also interviewed.
Qualitative content analysis (Mayring & Fenzel 2019) is a method for the systematic evaluation of qualitative data, in this case interviews. Qualitative content analysis bases on a structured analysis of textual data to identify patterns, themes, and connections. Initially, inductively developed categories serve as codes in schema (code book) in the second deductive phase. Subsequently, texts are analysed according to these categories/codes. Qualitative content (relevant statements from participants) may be quantified to determine the prominence/importance of a developed category.
After the coding procedure, the deployed condensation of findings on ordinal scales from 1 (lowest) to 6 (highest) per indicator is an analysis step that reflects a) the directional tendency on the topic, b) the vehemence of wording, and c) the (accumulated) length of the topical statements to arrive at one value per (sub-) indicator per respondent. The index values per research object are composed of scores on several sub-indicators. Out of these index values an average per (sub-) group (e.g., Swiss lower middle-class males) is determined.
4. Findings
4.1. Social Class, Gender, Migration History (A)
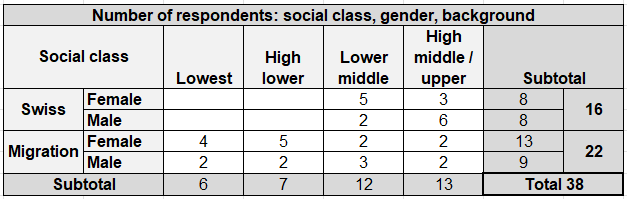
Table 1 provides an overview of the participants, gender and migration history are self-assigned by respondents. After comparison of statements on various factors, the self-assigned social class was in several cases corrected downward. Overall, most students with migration history are assignable to the lower and lower-middle classes, Swiss respondents rate exclusively as lower middle or high middle/upper classes.
Table 1. Number of Respondents by social class, gender and background
4.2. Ambitions & Visons (B)
The statements of respondents on different personal development and career future indicators show a moderate level of ambition and no differences along background and gender. However, a finer granulation incorporating social class reveals differences. Lowest values are found at specific females: lowest class & migrant respectively lower middle class & Swiss. The highest motivation shows in statements by migrant and Swiss higher-class females. Females show low scores on the ambition to start one’s own business, a vision integral to the purported goals of a business education. Typical quote: “In ten years, I would like to have a little family and a good and secure job”. The lowest class also lags the others in this future vision.
4.3. Investment, Efforts (C)
Regarding self-perceived investment and efforts for the study, no major differences based on gender and background can be made out. The overall score on investment is modest, which indicates that respondents did not necessarily provide socially desirable answers. The lowest class perceives itself in statements as lagging in investment of resources. Lower class females with a migrant background show the greatest variation in investment of resources for their study, the lowest as well as the highest investment were reported.
4.4. School Belonging (D)
A multitude of questions and topics were discussed in sizeable shares of the 38 interviews to arrive at values of the multiple indicators of School Belonging. Along the main categories, students with migration background score lowest by far, a large gap with the Swiss students’ value. Females also indicate a (slightly) below average School Belonging. From lowest to highest social class, the School Belonging increases strongly. The averages of migrants are low for all, besides the highest social classes, whereby females lag further behind in the two lower classes. Above average scores are found for all high middle/upper class students while the Swiss lower middle-class scores (far) above average as well.
4.5. Student Performance (E)
The students' self-reported current overall mark is sufficient for all groups, with an average of 4.8. Migrant, female, and lowest class students report lower marks. The averages of the sub-groups extend between 4.3 and 5.3, and once more the lower-class female migrants lag. Typical quote: “I don’t really have any grade goals; I just want to pass”. The highest average mark is found for lower middle class non-migrant male students.
5. Discussion
The research design has an explorative nature and is not suitable to robustly substantiate causality or correlations between the investigated factors. In addition, the sample is not representative of the school population and cannot be generalized. An inspection of scores of the respondents on the investigated factors can be used to formulate assumptions that may be substantiated with the appropriate representative samples and statistical analysis methods, as the research team will conduct in further studies.
Notably, the pattern along the respondents’ social class, gender and background on the indicator ambitions (B) is not very pronounced, the scores do not vary strongly and gravitate towards the moderate averages, than other factors that potentially influence performance (E). The preliminary finding holds that the modest variation on this indicator does not explain (large) distinctions in the ‘effect’, i.e. performance. The meritocratic argument ‘high motivation = good performance’ does not seem to be confirmed. Similarly, the extent of ambition may not influence the degree of School Belonging or vice versa. The vision of starting one’s own company, a sub-indicator of ambition, shows larger differences in the expected direction and may drive performance, if only for some respondents.
In a similar reasoning, the indicator investment, efforts (C) shows limited variation, and serves little explanation for variance in performance or School Belonging. Only the lowest class falls strongly behind on self-reported investment, and this may be an artefact of the tendency of self-blaming that is stronger at marginalized than at privileged groups (Schacter & Juvonen, 2015). Also, here the meritocratic reasoning (large investment of resources leads to education success) does not seem to apply. Along the respondents’ social class, gender and background, similar and strongly pronounced patterns of index values emerge in the (general sense of) School Belonging, and its sub-indicators a) academic belonging and ambition, b) return of study investments, and c) conflicting demands of study and employment.
Regarding the performance results (E), within a range confined by preconditions such as advanced semesters and previous success of respondents, a consistent tendency emerges: lower marks of students with a migrant background, and respondents with a low social class background. In addition, a slight gender gap can be made out. The preliminary finding holds that the emerging pattern is linked to School Belonging: the less included students feel, the lower their performance (Janke et al., 2024; Strayhorn, 2018; Tinto, 1993). However, the reversed causality, good performance leads to heightened School Belonging, must be considered.
The findings align with existing research, which demonstrates that students' backgrounds significantly influence their sense of belonging in school and their academic performance (Strayhorn, 2018; Tinto, 1993). This study further highlights the importance of inclusion and related concepts in shaping these outcomes. Within a diverse sample that varied by class, gender, and migration background, Swiss male students from high middle- and upper-class backgrounds did not score substantially higher on study-related success factors such as ambition and effort. However, they reported feeling the most included. Regrettably, the School of Business is not an outlier in this regard; it reflects the broader trends observed across HEIs, where patterns of student inclusion and their subsequent impact on performance remain consistent (Becker & Schoch, 2018).
6. Conclusion, Recommendations
A significant inclusion gap emerges in this study. Firstly, a link between School Belonging and performance of students is confirmed. Disparities regarding belonging and performance are observed between lower- and higher-class students, female and male students, as well as Swiss and migrant (history) students. The gap is particularly pronounced between male Swiss students from middle- and upper-class backgrounds and female migrant students from lower-class backgrounds. To address these inequities, several recommendations informed by empirical studies, and suggestions from interviewees can be formulated.
Enhancing Communication and Support Structures: Like many others, this particular HEI already provides various forms of student support. However, these services are often underutilized due to lack of awareness. Establishing a centralized study center could serve as an accessible hub, consolidating all support services and providing students with a clear overview of available resources. The separation of supportive roles from power roles would reduce power imbalances and create a more equitable environment for students seeking assistance.
Diversifying Faculty and Management: While the student body at universities of applied sciences is undeniably diverse, this diversity is not reflected in the composition of faculty and management. Diversity further diminishes at middle and senior management levels. To create a truly inclusive institution, it is imperative that the diversity of the faculty and management aligns with that of the student body. To this end, recruitment strategies should prioritize offering opportunities to migrant applicants, first-generation academics, and other underrepresented groups.
Challenging the Myth of Meritocracy: Despite clear evidence to the contrary, the notion of a meritocratic system continues to persist in many HEIs. A significant number of lecturers, as well as middle and senior management staff, fail to acknowledge the unequal distribution of opportunities among students. To address this issue, universities must invest in systematic data collection and analysis to better understand the barriers faced by students. For instance, students juggling low-paid jobs, lacking family support, or experiencing a sense of exclusion face significantly greater challenges in studying and progressing compared to peers with financial stability, high cultural capital, and a strong sense of belonging. Moreover, comprehensive staff education and training are critical to raising awareness of these disparities.
By addressing the inclusion gap, the institution can not only provide equitable opportunities for all students but also harness the full potential of its institution, faculty and diverse community.
Acknowledgments.
This study is funded by the School of Business FHNW.
References
Allan, B. A., Garriott, P., Ko, S.-J. “S.”, Sterling, H. M., & Case, A. S. (2023). Classism, work volition, life satisfaction, and academic satisfaction in college students: A longitudinal study. Journal of Diversity in Higher Education, 16(1), 66–75. https://doi.org/10.1037/dhe0000221
Atherwood, S.& Sánchez-Soto, G. (2023). Does Social Class Matter Equally for the Timely Transition Into and Out of College? Evidence from the NLSY97. Res High Educ 64, 95–128 (2023). https://doi.org/10.1007/s11162-022-09692-w
Becker, R., & Schoch, J. (2018). Soziale Selektivität. Empfehlungen des Schweizerischen Wissenschaftsrates SWR. Expertenbericht (Vol. 2018). Schweizerischer Wissenschaftsrat (SWR). https://boris.unibe.ch/125583/
Brown, J. K. & Papp, L. M. (2025). Evidence for College Students’ Decreasing Sense of Belonging over Time: Direct and Moderated Results. International Journal of Environmental Research and Public Health, 22(4), 472. https://doi.org/10.3390/ijerph22040472
Connelly, R., Gayle, V., & Playford, C. (2021). Social class inequalities in educational attainment: Measuring social class using capitals, assets and resources. Contemporary Social Science, 16(3), 280-293.
Deery, J., & Press, A. L. (2018). Introduction: studying media and class. In J. Deery & A. L. Press (Eds.), Media and class: TV, film, and digital culture (pp. 1–18). Routledge.
Giddens, A., Duneier, M., Appelbaum, R., & Carr, B. (2009). Introduction to sociology. WW Norton & Company.
Grusky, D. (2019). Social stratification, class, race, and gender in sociological perspective. Routledge.
Herbaut, E. (2021). Overcoming failure in higher education: Social inequalities and compensatory advantage in dropout patterns. Acta Sociologica, 64(4), 383-402. https://doi.org/10.1177/0001699320920916.
Janke, S., Messerer, L. A., Merkle, B., & Rudert, S. C. (2024). Why do minority students feel they don’t fit in? Migration background and parental education differentially predict social ostracism and belongingness. Group Processes & Intergroup Relations, 27(2), 278-299.
Langhout, R. D., Drake, P., & Rosselli, F. (2009). Classism in the university setting: Examining student antecedents and outcomes. Journal of Diversity in Higher Education, 2(3), 166–181. https://doi.org/10.1037/a0016209
Mayring, P. & Fenzl, T. (2019). Qualitative Inhaltsanalyse. In: Baur, N., Blasius, J. (Eds.) Handbuch Methoden der empirischen Sozialforschung. Springer VS. https://doi.org/10.1007/978-3-658-21308-4_42
Mills, C. W. (2019). The power elite. In Social Stratification, Class, Race, and Gender in Sociological Perspective, Second Edition (pp. 202-211). Routledge.
Rubin, M., Denson, N., Kilpatrick, S., Matthews, K. E., Stehlik, T., & Zyngier, D. (2014). “I Am Working-Class”: Subjective Self-Definition as a Missing Measure of Social Class and Socioeconomic Status in Higher Education Research. Educational Researcher, 43(4), 196–200. https://doi.org/10.3102/0013189X14528373
Schacter, H. L., & Juvonen, J. (2015). The effects of school-level victimization on self-blame: Evidence for contextualized social cognitions. Developmental psychology, 51(6), 841.
Stopforth, S., & Gayle, V. (2022). Parental social class and GCSE attainment: Re-reading the role of ‘cultural capital’. British Journal of Sociology of Education, 1-20.
Strayhorn, T. L. (2018). College students' sense of belonging: A key to educational success for all students. Routledge.
Tinto, V. (1993). Leaving college. Rethinking the causes and cures of student attrition (Second Edition). The University of Chicago Press.
1 The research design is informed by Langhout et al.'s (2009) multivariate process model of classism antecedents and outcomes, serving as a conceptual framework.
2 In the context of HEI “1st generation” indicates the respondent is the first in the family to study at a HEI.