Fostering Statistical Thinking through a Challenge-Based Multivariate Data Analysis Course
Statistical Thinking in a Challenge-Based Multivariate Course
Fostering Statistical Thinking through a Challenge-Based Multivariate Data Analysis Course
Blanca
Rosa Ruiz Hernández
 ,
Raúl Gómez Muñoz
Tecnologico de Monterrey, Mexico.
How to cite: Ruiz Hernández, B.; Gómez Muñoz, R. Fostering Statistical Thinking through a Challenge-Based Multivariate Data Analysis Course. In: 12th International Conference on Higher Education Advances (HEAd’26). Valencia, 15-18 June 2026. https://doi.org/10.4995/HEAd26.2026.21732
Abstract
This study examines how statistical thinking develops in a challenge-based multivariate data analysis course with fifth-semester undergraduate Data Science students using real air quality data. Using the framework of Wild and Pfannkuch, we conducted a qualitative longitudinal analysis of team reports developed throughout the stages of the challenge. Results show that statistical thinking develops progressively, from context-driven problem formulation to data-informed decisions, justified model selection, and integrated interpretation. These findings suggest that the structured, stage-based design of the challenge can support statistical thinking as a dynamic process beyond the procedural use of multivariate techniques, offering insights for the design of advanced statistics courses.
Keywords: Statistical thinking; Multivariate data analysis; Challenge-based learning; Statistics education; Educational innovation; Higher education.
1. Introduction
Wild and Pfannkuch (1999) identify statistical thinking with the complex thought processes involved in solving real-world problems using statistics. These processes involve not only the application of statistical techniques, but also other complex tasks such as understanding the context of the problem, collecting and preparing the necessary data, modeling the statistical phenomena, and interpreting the results. However, a common issue in higher education is that students often learn to apply statistical techniques in a purely procedural manner, without developing the statistical thinking needed to interpret, question, and contextualize the results obtained (Batanero, 2004).
In response to this deficiency, there has been a growing interest in Project-Based Learning (PBL) and Challenge-Based Learning (CBL) approaches. From a PBL perspective, learning is constructed through projects that require students to formulate questions, make methodological decisions, and integrate procedural knowledge with conceptual understanding in order to address a real-world problem, thus fostering active, understanding-oriented learning (Blumenfeld et al., 1991; Thomas, 2000). On the other hand, the CBL approach centers the learning process around an authentic challenge that introduces uncertainty and requires iteration, reflection, and the progressive adjustment of proposed solutions (Johnson et al., 2009; Nichols et al., 2016).
However, despite these pedagogical efforts, recent studies indicate that the difficulty in developing statistical thinking among undergraduate students persists, even in advanced courses that use real-world data (Zieffler et al., 2018). Wild and Pfannkuch’s (1999) proposal for addressing this issue in statistical education was to develop structured frameworks that could guide students through the process of completing a statistical project, enabling them to make sense of the experience, learn from it, and transfer their insights to others. But even though challenge- and project-based approaches are increasingly adopted in statistics and data science education, there is still limited empirical evidence on how specific instructional designs can support the development of statistical thinking in advanced multivariate settings.
With this context in mind, this paper considers an undergraduate course on multivariate data analysis offered within a Data Science program at Tecnologico de Monterrey, Mexico, designed under the Tec21 educational model. The course is structured around a four-stage challenge based on real environmental data, developed in collaboration with an external partner, in which students apply multivariate statistical techniques to address a complex problem related to air quality. The research questions guiding this study are:
RQ1: Which components of statistical thinking, as defined in the theoretical framework of Wild and Pfannkuch (1999), are evident in each stage of the challenge?
RQ2: How does the structure and design of the challenge facilitate the emergence and development of students’ statistical thinking across its stages?
By analyzing student artifacts produced at each stage, this study contributes to understanding how instructional design can support the development of statistical thinking in data science education.
The paper is organized as follows: first, the institutional and course context, along with the design of the challenge, are presented. This is followed by the analytical framework and methodology, where the components of statistical thinking based on Wild and Pfannkuch (1999) are defined. The results are then reported in two parts: the components of statistical thinking across the stages of the challenge and their emergence in students. Finally, the main findings are discussed.
2. Context of the study
2.1. Institutional and Course Context
This study is conducted within the Tecnologico de Monterrey’s Tec21 model, grounded in competency-based learning through authentic, challenge-based experiences (Tecnologico de Monterrey, 2019). In this model, learning is framed around the development of observable competencies and demonstrated through student products that serve as evidence of reasoning.
Within this context, the course Application of Multivariate Methods (fifth semester) is structured around a central challenge that guides the learning experience throughout the five-week academic period (20 hours per week, including 4 hours per week dedicated to the challenge, increasing to 8 hours in the final week). The course involved 27 undergraduate students in the Data Science program, organized into six teams of four to five students. Multivariate analysis techniques are initially introduced individually, with dedicated space for their understanding and application, and are then progressively integrated into the solution of the challenge. In this sense, the challenge serves as an organizing framework for students’ decisions, analyses, and interpretations, positioning multivariate analysis as a set of tools for making sense of complex phenomena with real-world data.
2.2. Design of the Challenge
The challenge is implemented as a structured, four-stage experience aligned with the CRISP-DM (Cross-Industry Standard Process for Data Mining) methodology (Chapman et al., 2000), and is designed to address a real-world problem through the application of multivariate statistical techniques. Throughout the process, students work in collaborative teams to define the overall goal of their project, prepare and explore complex data, apply multivariate models, and communicate their results. Student products (developed progressively across the stages) include team-based reports for each stage, culminating in a final technical report, an oral presentation, and an individual reflection.
In this study, the challenge is developed in collaboration with the Sistema Integral de Monitoreo Ambiental (SIMA), the agency responsible for monitoring air quality in the Monterrey Metropolitan Area. SIMA provides the problem context, real environmental datasets, and specialized feedback, acting as an external stakeholder that informs and evaluates students’ analytical work throughout the challenge. The objective is to analyze the relationships between atmospheric pollutants and meteorological variables using data from multiple monitoring stations to identify relevant multivariate patterns and contextualize the results in relation to regulatory standards and environmental policies. Table 1 summarizes, for each challenge stage, the corresponding key student outputs and the planned interactions with both the external partner and the teaching team.
Table 1. Challenge structure aligned with CRISP-DM and scheduled external partner interactions. Source: Own elaboration.
Challenge stage |
Main purpose |
Key outputs |
External partner interactions |
Stage 1. Problem understanding |
Define and delimit the analytical problem |
Problem statement; analytical objective |
Presentation of the context; problem scoping |
Stage 2. Data understanding and preparation |
Explore and prepare the environmental data |
Clean dataset; descriptive analysis |
Clarification of technical questions regarding variables and data |
Stage 3. Modeling and evaluation |
Apply and validate multivariate models |
Statistical models; partial results |
Feedback on progress and relevance of the partial results |
Stage 4. Communication and interpretation |
Interpret and communicate results |
Final report; oral presentation; individual reflection |
Final evaluation and overall feedback |
3. Analytical Framework and Methodology
The study was conducted in a fifth-semester undergraduate multivariate analysis course in the Data Science program, where students had prior knowledge of descriptive statistics, inference, and modeling, as well as experience with statistical software. The analysis focused on student artifacts produced during the challenge. One team was selected through purposeful sampling based on the extent to which their artifacts evidenced statistical thinking and enabled reconstruction of evolving objectives, analytical decisions, and interpretations (Table 1).
To interpret these artifacts, we adopted the framework of Wild and Pfannkuch (1999), which conceptualizes statistical thinking through four complementary dimensions. The Investigative Cycle (Dim 1) describes the iterative phases of inquiry following the PPDAC model (problem formulation, planning, data management, analysis, and conclusions). The Types of Thinking (Dim 2), encompassing core statistical reasoning and general modes such as strategic thinking. The Interrogative Cycle (Dim 3) represents continuous questioning, critique, and refinement across all stages of inquiry, rather than within a single phase. Finally, the Dispositions (Dim 4), refer to attitudes such as curiosity and skepticism. These dimensions provide a lens for examining statistical thinking across challenge stages.
4. Results
4.1 Components of Statistical Thinking Across Challenge Stages
This section examines how the different components of statistical thinking are emphasized over the duration of the challenge. The analysis is organized by stage, as student work was produced sequentially following this structure, enabling statistical thinking to be interpreted in relation to the specific demands of each phase. The Interrogative Cycle (Dim 3) is not treated separately, since questioning and critique permeate all stages of the challenge rather than being confined to a single phase. An overview of this mapping is provided in Table 2.
Table 2. Components of statistical thinking emphasized across challenge stages. Source: Own elaboration.
Challenge stage |
Statistical thinking focus |
Investigative Cycle (Dim1) |
Types
of thinking |
Dispositions (Dim4) |
Stage 1. Problem understanding |
Framing and delimiting a meaningful, analyzable problem grounded in context |
Problem formulation; planning |
Need
for data; integration of statistical and contextual
knowledge; |
Curiosity; imagination; openness to uncertainty |
Stage
2. |
Making sense of real, imperfect data through exploration and description |
Planning; data exploration |
Attention to variation; transnumeration; strategic thinking; critical reading of data distributions and relations between variables |
Engagement; attentiveness to data quality; openness to revising goals |
Stage 3. Modeling and evaluation |
Selecting, justifying, and evaluating multivariate models |
Analysis; evaluation |
Use of models; application of techniques and seeking explanations; evaluation of assumptions and model performance |
Skepticism; perseverance; logical reasoning |
Stage 4. Communication and interpretation |
Integrating results and interpreting them in context |
Interpretation; conclusion |
Integration of statistical and contextual knowledge; strategic and explanatory reasoning when interpreting models |
Reflective judgment; accountability; sense-making |
4.2 Emergence and Development of Statistical Thinking Across the Challenge
This section analyzes the emergence and development of statistical thinking across the different stages of the challenge, with particular attention to the transitions between stages — which are interpreted as shifts along the Investigative Cycle (Dim 1) — based on the work of a representative team. The analysis does not focus on the technical results obtained, but rather on changes in how students formulate the problem, make analytical decisions, and interpret multivariate results. The student artifacts produced at each stage are used as the primary sources of evidence. Figure 1 synthesizes this progression, illustrating how statistical thinking evolves across stages and highlighting the dominant forms of reasoning that become more visible at each stage.
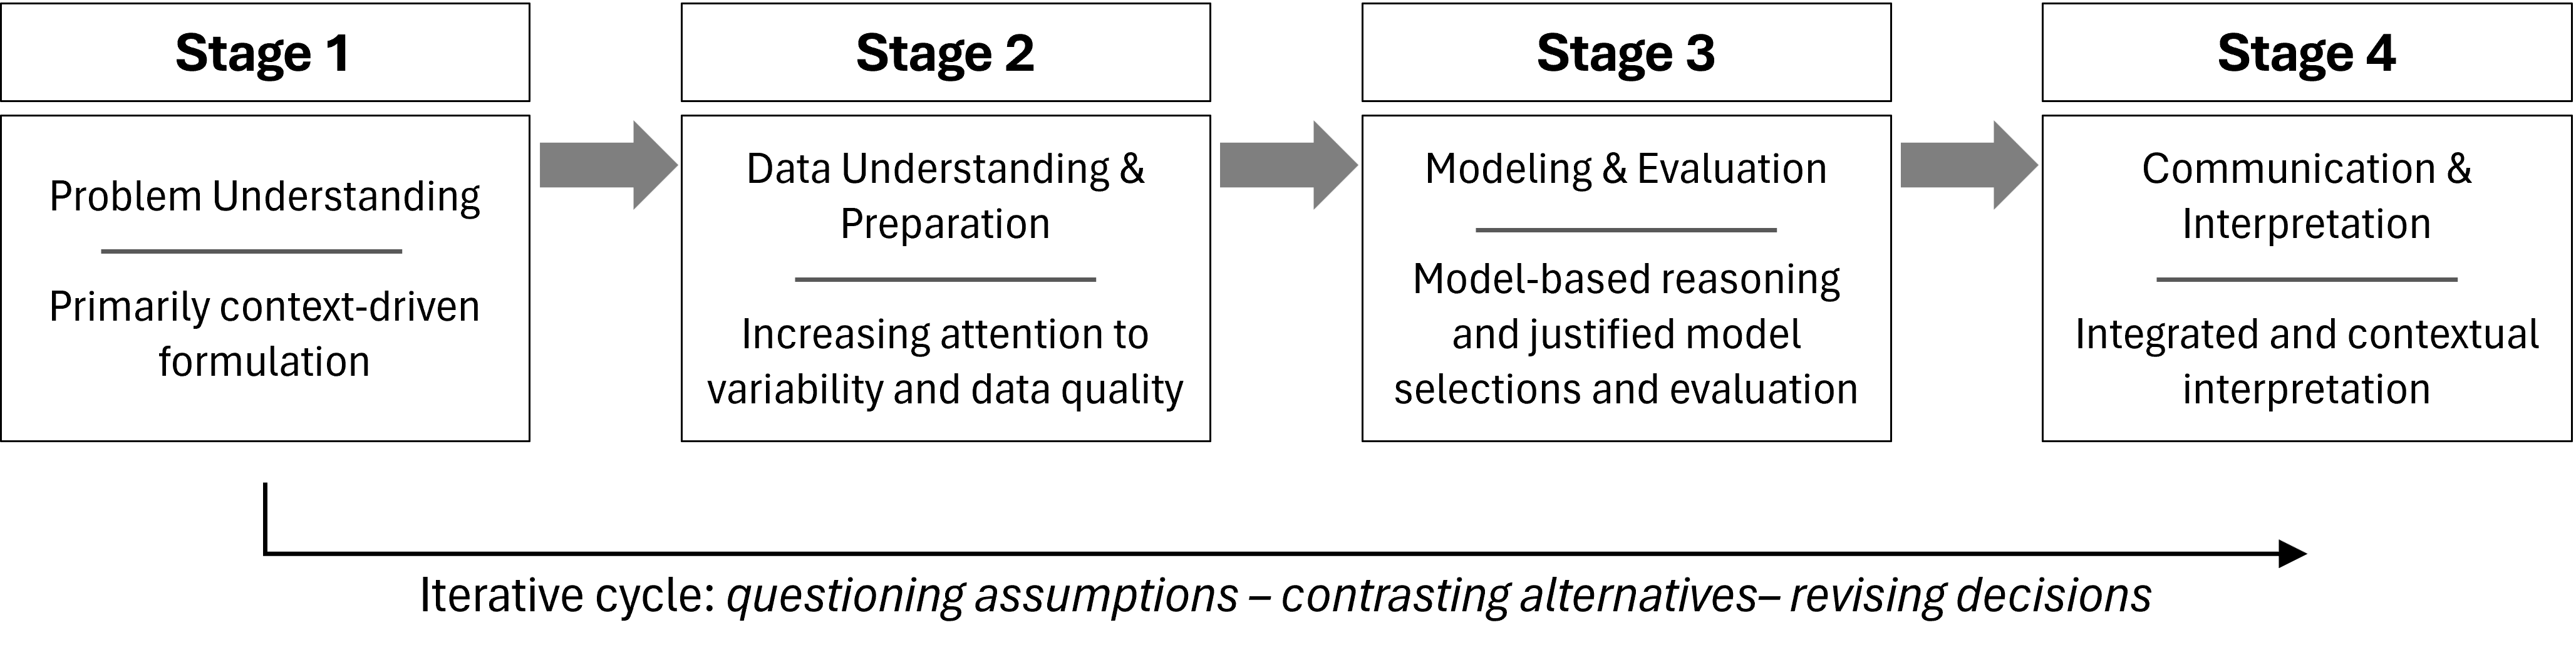
Figure 1. Challenge structure and progression of statistical thinking across stages, highlighting dominant forms of reasoning. Source: Own elaboration.
In the transition from Stage 1 to Stage 2, the team’s statistical thinking moves from a primarily context-driven problem formulation toward one increasingly informed by the data. While Stage 1 centers on delimiting a broad problem based on contextual knowledge, Stage 2 introduces new analytical constraints through direct engagement with the data, leading to greater attention to the forms of reasoning associated with variability, data quality, and variable relevance (Types of Thinking, Dim 2). For instance, the team refined its initial objective after identifying limitations in the available variables for capturing relationships between air quality and meteorological conditions. As a result, the team shows a disposition to reformulate its original question in light of what the data allow (Dispositions, Dim 4), reflecting an emerging integration of context and empirical evidence.
In the transition from Stage 2 to Stage 3, the team’s statistical thinking moves from descriptive exploration toward model-oriented decision-making. The team begins to justify its model choices in relation to their analytical objectives and the characteristics of the data, for example when prioritizing Pillai’s trace over other multivariate test statistics due to its greater robustness. This signals more reflective, model-based reasoning (Types of Thinking, Dim 2), while their willingness to revisit procedures when results conflict with expectations reflects an emerging disposition toward critical reflection (Dispositions, Dim 4).
In the transition from Stage 3 to Stage 4, the team’s statistical thinking shifts from producing model results toward an integrated, contextual interpretation. Results are connected to the environmental problem, and the team explicitly recognizes the scope and limits of its analyses, for example, noting that the study is observational and does not warrant causal claims. This reflects more integrative, context-sensitive reasoning (Types of Thinking, Dim 2) and a mature disposition toward critical judgment (Dispositions, Dim 4).
Overall, the analysis of the team’s work across the challenge reveals that statistical thinking develops progressively, in relation to the demands of each stage. The team moves from an initial, context-driven problem formulation toward data-informed decisions, justified statistical modeling, and an integrated interpretation of results in relation to the environmental problem. This progression is supported by a design that gradually introduces situations that require students to question assumptions, contrast alternatives, and revise prior decisions, thereby sustaining an iterative cycle of interrogation and critique throughout the process. Thus, the observed development of statistical thinking responds both to the sequence of challenge stages and to the opportunities for reflection they provide, illustrating how a challenge-based design can support increasingly complex forms of statistical thinking.
5. Discussion and Conclusions
The findings suggest that students’ statistical thinking does not emerge as a competency reduced to the correct application of isolated techniques, but as a process progressively constructed throughout the challenge. As students move through the stages, their reasoning shifts from primarily context-driven problem formulations toward decisions increasingly informed by data, models, and their interpretive implications. This development is reflected in the reformulation of objectives, explicit attention to variability and data quality, justification of methodological choices, and a more cautious interpretation of results. In this sense, statistical thinking is better understood as a dynamic, context-sensitive form of reasoning linked to decision-making in empirical inquiry, consistent with prior work (Pfannkuch & Wild, 2004; Wright et al., 2024).
This progression is closely linked to the design of the challenge and its sequence of stages, which create systematic opportunities to contrast ideas with evidence, justify decisions, and revise prior choices. Rather than responding to prescriptive instructions, students engage in statistical thinking as a necessity when working with open problems and complex data. Collaboration with an external partner grounds the challenge in real-world constraints, reinforcing the need to justify decisions and interpret results beyond purely academic criteria, in line with recent perspectives on challenge-based learning (Helker et al., 2025).
These findings should be interpreted in light of the study’s scope. The analysis focused on a representative team, enabling an in-depth examination of reasoning processes across stages, but does not support broad generalizations. From a pedagogical perspective, the study highlights how sequencing challenge stages and real-world data can scaffold statistical thinking in advanced courses. Overall, challenge-based designs structured through sequenced stages can foster increasingly sophisticated statistical thinking as an integrated, contextual, and reflective process. Future work could extend this analysis by incorporating individual reflections, comparing more teams, or examining the role of interactions with external partners.
References
Batanero, C. (2004). Statistics education as a field for research and practice. Regular lecture presented at the Tenth International Congress on Mathematical Education (ICME-10), Copenhagen, Denmark.
Blumenfeld, P. C., Soloway, E., Marx, R. W., Krajcik, J. S., Guzdial, M., & Palincsar, A. (1991). Motivating project-based learning: Sustaining the doing, supporting the learning. Educational Psychologist, 26(3–4), 369–398. https://doi.org/10.1080/00461520.1991.9653139
Chapman, P., Clinton, J., Kerber, R., Khabaza, T., Reinartz, T., Shearer, C., & Wirth, R. (2000). CRISP-DM 1.0: Step-by-step data mining guide. SPSS.
Helker, K., Bruns, M., Reymen, I. M. M. J., & Vermunt, J. D. (2025). A framework for capturing student learning in challenge-based learning. Active Learning in Higher Education, 26(1), 213–229. https://doi.org/10.1177/14697874241230459
Johnson, L., Smith, R., Smythe, J. T., & Varon, R. K. (2009). Challenge-based learning: An approach for our time. New Media Consortium.
Nichols, M., Cator, K., & Torres, M. (2016). Challenge-based learning: A classroom guide. Digital Promise.
Pfannkuch, M., & Wild, C. J. (2004). Towards an understanding of statistical thinking. In D. Ben-Zvi & J. Garfield (Eds.), The challenge of developing statistical literacy, reasoning and thinking (pp. 17–46). Springer.
Tecnologico de Monterrey. (2019). Modelo educativo Tec21. Tecnologico de Monterrey.
Thomas, J. W. (2000). A review of research on project-based learning. Autodesk Foundation.
Wild, C. J., & Pfannkuch, M. (1999). Statistical thinking in empirical enquiry. International Statistical Review, 67(3), 223–265. https://doi.org/10.1111/j.1751-5823.1999.tb00442.x
Wright, C., Meng, Q., Breshock, M. R., Atta, L., Taub, M. A., Jager, L. R., Muschelli, J., & Hicks, S. C. (2024). Open case studies: Statistics and data science education through real-world applications. Journal of Statistics and Data Science Education, 32(4), 331–344. https://doi.org/10.1080/26939169.2024.2394541
Zieffler, A., Garfield, J., DelMas, R., & Reading, C. (2018). What does it mean to reason statistically? Statistics Education Research Journal, 17(2), 5–27.