Expanding What Can Be Automatically Assessed in Microeconomics: Symbolic, Graphical and Parametric Questions with STACK
Automated symbolic and graphical assessment with feedback in microeconomics
Expanding What Can Be Automatically Assessed in Microeconomics: Symbolic, Graphical and Parametric Questions with STACK
Loreto
Llorente
 ,
Javier Puértolas
Department of Economics, Universidad Pública de Navarra, Spain.
How to cite: Llorente, L.; Puértolas, J. (2026). Expanding What Can Be Automatically Assessed in Microeconomics: Symbolic, Graphical and Parametric Questions with STACK. In: 12th International Conference on Higher Education Advances (HEAd’26). Valencia, 15-18 June 2026. https://doi.org/10.4995/HEAd26.2026.21790
Abstract
Teaching Microeconomics poses persistent challenges due to the high level of abstraction and mathematical formalism required to understand economic models. Traditional assessment methods often fail to capture symbolic and graphical reasoning and provide limited opportunities for immediate feedback, particularly in large classes. This paper presents the implementation of STACK (System for Teaching and Assessment using a Computer Algebra Kernel) as an environment for automated assessment integrated with learning in undergraduate Microeconomics courses. STACK questions combine symbolic input, parameter randomization, and interactive graphical representations implemented with JSXGraph, allowing both algebraic and graphical student responses to be automatically evaluated. The methodology was applied across several Economics and Business degrees, involving more than 470 students. Student perceptions were collected through structured surveys, revealing high satisfaction with the clarity of feedback, the possibility of multiple attempts, and the integration of graphical and analytical reasoning. Results suggest that automated STACK-based assessment supports active learning and provides a scalable approach to formative and summative assessment in quantitatively oriented subjects.
Keywords: Microeconomics education; automated assessment, STACK, formative feedback, interactive learning.
1. Introduction
Undergraduate Microeconomics is widely recognized as a subject that presents significant learning difficulties. Students are required to move between verbal reasoning, graphical representations, and formal mathematical models, often without sufficient opportunities for guided practice. Large class sizes further complicate the provision of individualized feedback, which is essential for developing symbolic reasoning skills and for correcting misconceptions at early stages. As a result, assessment in these courses frequently relies on problem sets with delayed feedback or on multiple-choice formats that cannot adequately evaluate algebraic, graphical, and model-based reasoning.
Digital assessment tools have emerged as a potential response to these challenges. However, many online systems focus on numerical answers or predefined options and are not well suited to evaluating symbolic expressions, graphical constructions, or the integration of multiple representations. In mathematically intensive subjects such as Microeconomics, this limitation restricts the pedagogical potential of online assessment and weakens its role as a learning tool.
STACK and JSXGraph have been widely developed and documented in the context of STEM education, particularly in mathematics and physics, where extensive question banks, tutorials, and pedagogical materials are available. However, their use in economics education—especially in Microeconomics—remains limited, and there is a lack of subject-specific materials that integrate symbolic evaluation, graphical construction, and economic modelling. The present work therefore involves not only the adoption of existing tools but also their adaptation to a disciplinary context for which they were not originally designed.
This study explores the use of STACK (System for Teaching and Assessment using a Computer Algebra Kernel) as an environment for automated assessment integrated with learning in Microeconomics courses. STACK enables the automatic evaluation of algebraic expressions, the use of parameter randomization, and the design of adaptive feedback through potential response trees. When combined with interactive graphics implemented through JSXGraph, it allows students to work simultaneously with symbolic and graphical representations of economic models and to have both types of responses assessed automatically.
The aim of this paper is to analyse the implementation of STACK-based activities across several undergraduate Microeconomics courses and to evaluate their pedagogical contribution from the students’ perspective. Specifically, the study examines how this approach supports active learning, formative feedback, and the integration of mathematical and graphical reasoning through automated, parametric, and multimodal assessment in large university classes.
2. Methodology
The study was conducted across several undergraduate Microeconomics courses in Economics and Business degrees, covering first-, second- and third-year students. Over two academic years, the methodology reached more than 470 students, with intensive implementation in first-year courses (over 300 students in 12 groups).
STACK-based activities were integrated into practical sessions held in computer labs and used both as learning tools and as part of continuous assessment. Each session included approximately eight sequential questions combining symbolic input, algebraic expressions, and interactive graphs implemented through JSXGraph. Parameters and functions were randomized for each student, ensuring individualized problem sets while maintaining comparable structures. Students were allowed multiple attempts and received adaptive feedback through potential response trees, enabling them to identify and correct specific errors.
In addition to symbolic answer evaluation, questions incorporated interactive graphical elements embedded directly within the assessment items. These graphs enabled students to manipulate economic curves, constraints, and equilibrium conditions dynamically while formulating their mathematical responses. STACK automatically interprets students’ symbolic input and identifies specific issues related to format, structure, or mathematical reasoning, generating targeted feedback accordingly. Figure 1 illustrates this process, showing how detailed automated feedback is provided when the student’s symbolic input is partially incorrect.
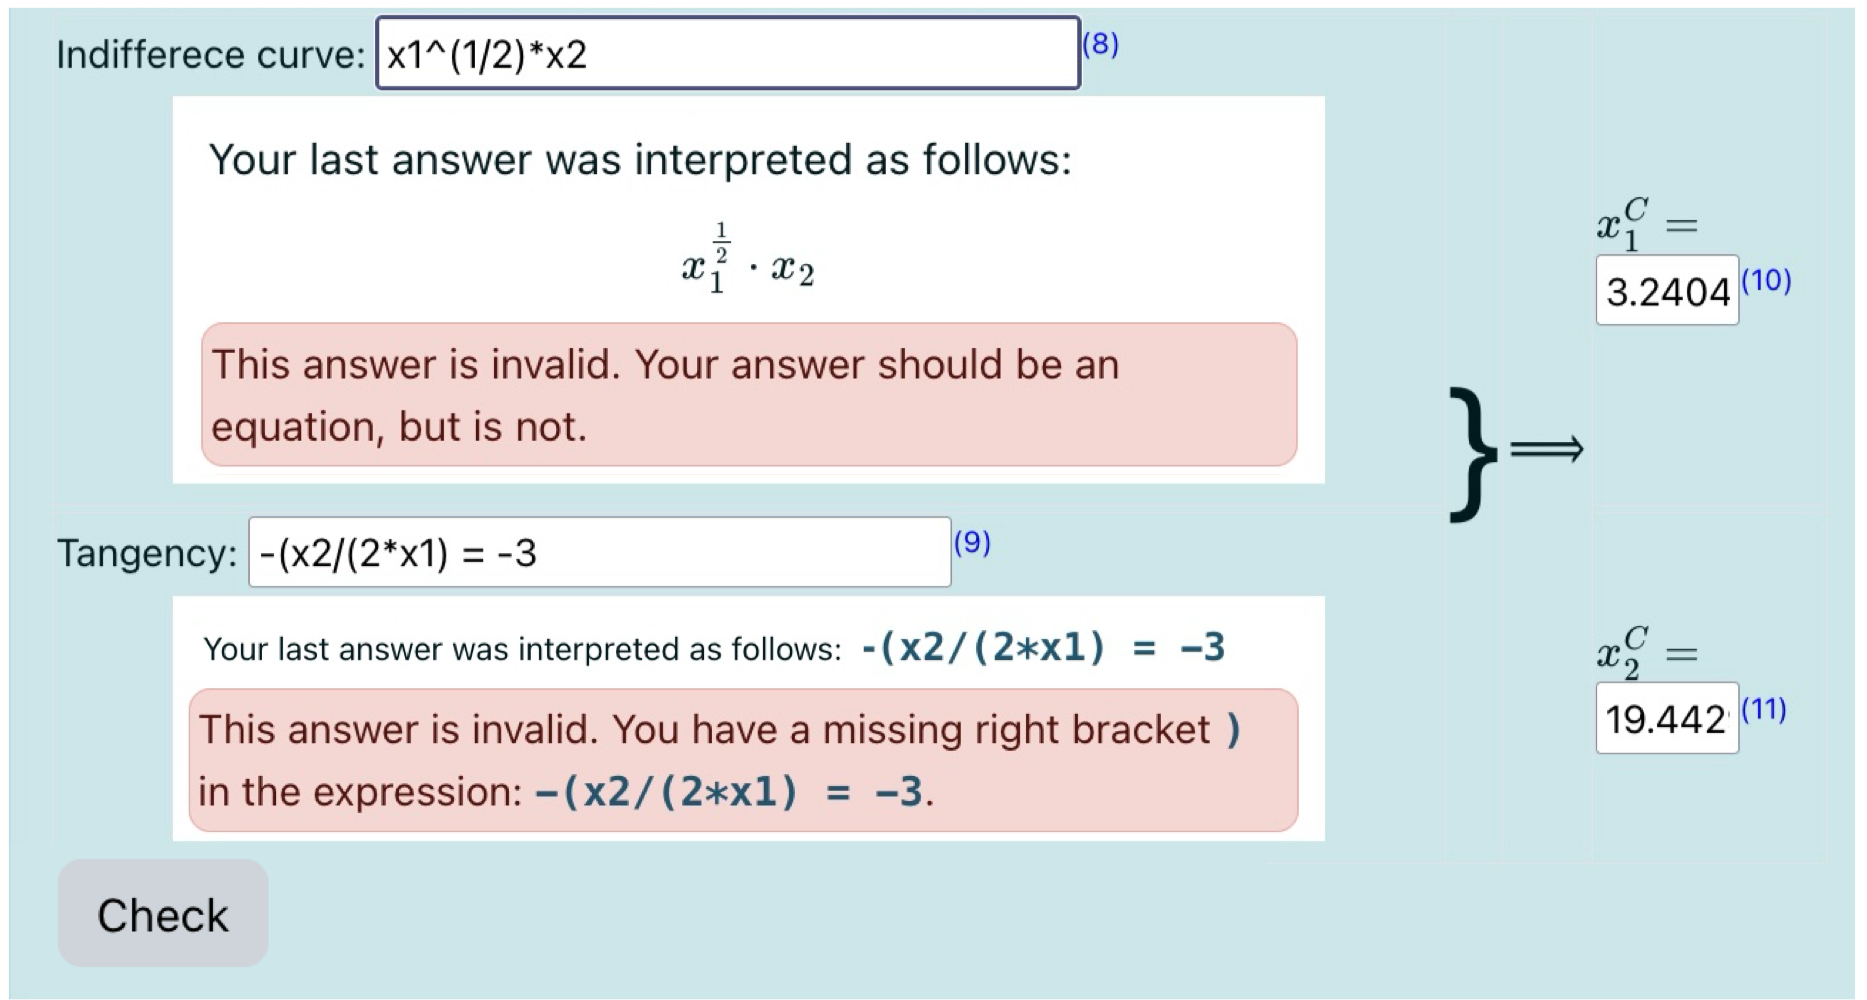
Figure 1. Example of automated symbolic answer interpretation and targeted feedback generated by STACK when the student’s input format or structure is incorrect. Source: authors’ own work (2025).
Beyond numerical and symbolic input, several questions required students to construct graphical elements directly within the interactive figure. Students placed lines, equilibrium points, directional arrows, and adjusted parameter controls until specified economic or mathematical conditions were satisfied. These graphical actions were recorded and assessed as part of the student response. Assessment therefore extended beyond symbolic computation to include the construction and interpretation of graphical representations of economic models, creating a unified graphical–symbolic workflow within a single automated learning and assessment environment. Figure 2 shows a representative STACK question integrating an interactive JSXGraph figure, symbolic input, and automated feedback within a single assessment task.
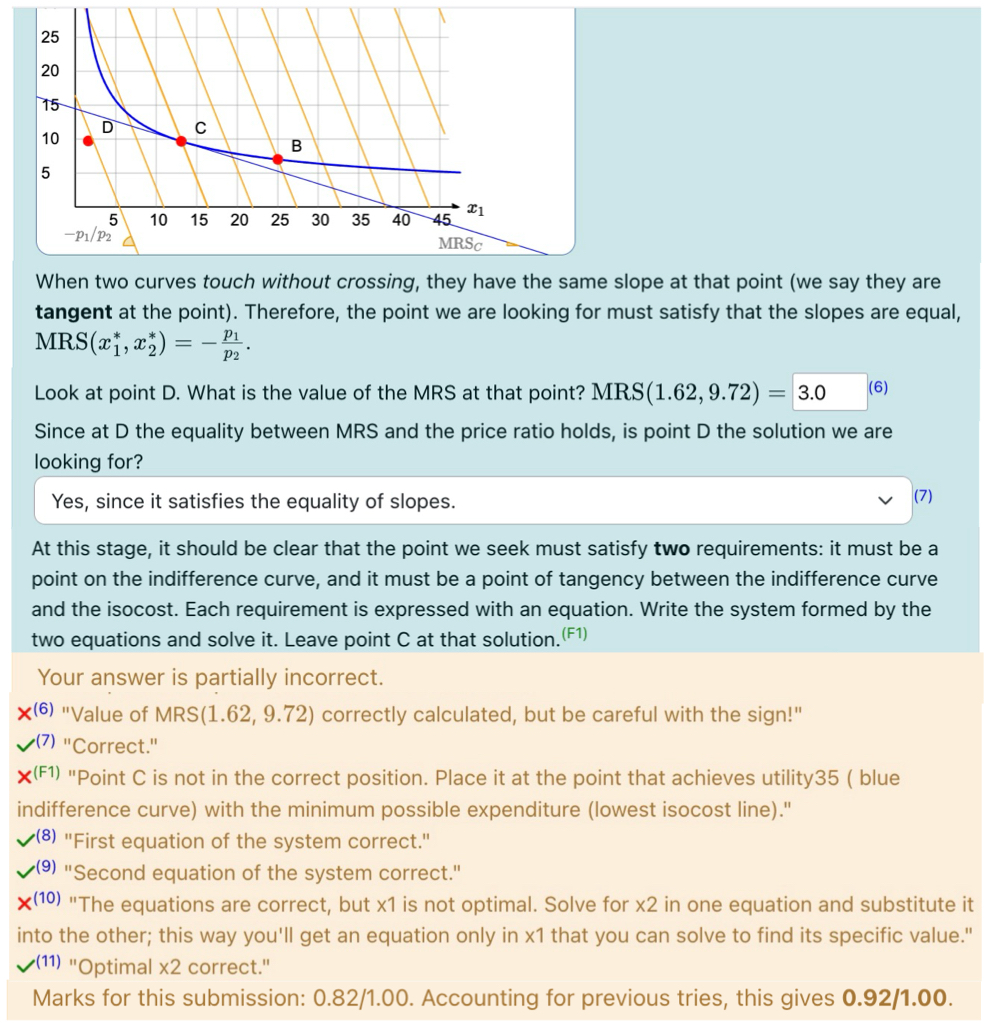
Figure 2. Example of a STACK question integrating symbolic input, interactive graphical construction with JSXGraph, and automated feedback through potential response trees. Source: authors’ own work.
Before the implementation of STACK-based activities, practical sessions already incorporated interactive graphical resources. Students worked with shared interactive graph files and responded to the same set of questions in Word documents, sometimes followed by a test. Although this format introduced a visual and interactive component, all students worked with identical data and functions, and feedback was neither immediate nor adaptive. The new methodology differs not in the mere presence of interactivity, but in three main aspects: (1) parameter randomization, assigning different datasets and functions to each student; (2) automated symbolic answer evaluation through STACK; and (3) structured adaptive feedback via potential response trees, enabling iterative learning during the task.
Student perceptions were collected through anonymous surveys combining Likert-type items (1–5) and 1–10 scales, including questions comparing the previous shared-interactive practices with the new individualized STACK-based approach. Open-ended questions gathered qualitative feedback. A small set of representative STACK questions, illustrating symbolic evaluation and graphical construction, has been made available online as supplementary material for illustrative purposes (available at: https://miaulario.unavarra.es/x/zzIiiA).
This implementation required the design of new question types and graphical interactions specific to Microeconomics, as existing STACK and JSXGraph resources are primarily oriented toward mathematics and physics education.
3. Results
Survey responses show that students consistently rated the individualized STACK-based practices more positively than the previous shared interactive format. This pattern appears across courses and items related to understanding, engagement, and preference for the methodology.
3.1. Preference for the interactive STACK-based methodology
Across courses, students clearly preferred the individualized interactive practices over the previous shared interactive format.
In the first-year Microeconomics course (n = 27), students rated the traditional practice format (same file + Word answers + test) with a mean of 3.04/5, whereas the interactive practices with individualized data reached 4.19/5 (survey data, Microeconomics I course). Similarly, agreement with the statement that personalized practices helped them understand concepts better obtained a mean of 4.04/5 (survey data, Microeconomics I course).
In the Business Administration course (n = 48), the traditional method obtained a mean of 2.88/5, while the interactive individualized practices reached 4.08/5. Furthermore, students expressed a strong preference for extending this model: the desire for all practices to follow the individualized format scored 4.21/5 (survey data, Business Administration course).
In Microeconomics II (international double degree, n = 19), the same pattern appears. The statement “This method helped me better understand the concepts” regarding individual datasets obtained 4.42/5, and students reported learning more with this methodology than with traditional assignments (mean 4.11/5) (survey data, Microeconomics II course)
3.2. Perceived learning benefits
Students consistently highlighted features directly linked to the STACK-based design. First, immediate feedback and multiple attempts were frequently mentioned in open-ended responses, as students valued knowing their mistakes instantly and being able to correct them, which they associated with deeper understanding rather than mere grading. Second, the integration of graphical and mathematical reasoning was highly appreciated, with students describing the activities as more visual, intuitive, and closer to exam-style reasoning. Finally, individualization through randomization was emphasized as a factor that prevented copying and encouraged individual reasoning while still allowing peer discussion at a conceptual level. These aspects align with higher agreement levels in items related to understanding and engagement in interactive sessions (means above 4/5 in several courses).
3.3. Qualitative feedback
Open-ended answers reinforce the quantitative results. When asked about the best aspect of the course, a large number of students explicitly mentioned “prácticas interactivas”, “the interactive practices”, or similar expressions. Advantages identified include better understanding of errors, more active involvement, a stronger connection between graphs and formulas, and greater motivation.
Reported disadvantages mainly relate to time pressure or task difficulty, rather than rejection of the methodology itself.
4. Discussion
The results suggest that the positive student perception of the new methodology cannot be attributed merely to the use of interactive graphics, which were already present in the previous instructional approach. Instead, the findings point to the pedagogical relevance of three tightly connected design elements: individualization, multimodal assessment, and the integration of graphical and symbolic reasoning within a sequential modelling structure.
4.1. From interactivity to meaningful individualization
While the earlier methodology included shared interactive graphs, all students worked with identical data and answered in a conventional document format. The STACK-based approach introduced deep parametrization: each student worked with different functions, datasets, answer options, and even visual features such as curve colours. This prevented answer recognition based on superficial cues and required students to interpret representations in each instance.
Student feedback consistently highlights this aspect as promoting genuine engagement and reducing direct copying. The pedagogical value, therefore, lies not in interactivity alone, but in interactivity combined with individualized modelling contexts that demand active interpretation.
4.2. Expanding what can be assessed
A central contribution of the approach is the expansion of the range of learning outcomes that can be evaluated automatically. Traditional online systems typically focus on numerical or short textual responses. In contrast, the implemented environment supported a wide range of automatically assessed responses, including symbolic algebraic expressions; graphical constructions such as lines, points, and arrows; identification of economically meaningful areas (e.g., profit regions); parameter adjustments under constraints; conceptual menu selections; context-dependent true/false statements; and ordered fragments forming formal economic statements. Automation in this context did not merely speed up grading but broadened the cognitive and representational scope of assessment. Tasks aligned more closely with the representational practices of economic modelling, where meaning is constructed through the interaction between equations, graphs, and conceptual language.
4.3. Linking graphical reasoning and conceptual understanding
Requiring students to construct graphical objects and areas representing economic magnitudes (such as economic profit) integrates spatial reasoning with conceptual economic understanding. Instead of treating graphs as illustrations of previously derived results, graphical representations became objects of reasoning and assessment themselves.
This tight coupling between graphical interaction and symbolic reasoning appears to support students in connecting abstract mathematical formulations with their economic meaning, a well-known difficulty in introductory Microeconomics.
4.4. Assessment as a modelling process
The sequential structure of the sessions transformed assessment into a progressive modelling activity. Chains of questions built around the same firm or market situation required students to develop a coherent representation of a model across multiple steps. Even when earlier answers were incorrect, subsequent tasks provided the expected values graphically, allowing the modelling process to continue.
This design reduced the “penalty cascade” effect typical of multi-step problems and emphasized reasoning processes over isolated final answers. Assessment thus became more aligned with how economic models are constructed and refined in practice.
4.5. Formative feedback in large groups
Immediate and adaptive feedback, delivered through potential response trees, was repeatedly identified by students as one of the most valuable aspects of the methodology. In large cohorts, providing detailed feedback on symbolic and graphical reasoning is typically unmanageable. The automated environment made such feedback scalable, supporting formative assessment without increasing marking instructors’ grading workload.
4.6. Limitations
The study is based primarily on student perceptions rather than direct measures of learning outcomes. While some descriptive improvements in academic performance were observed, these cannot be interpreted as causal effects. Additionally, the design of STACK-based activities involves an initial learning curve for instructors, although this is compensated by scalability and reusability.
5. Conclusions
The implementation of STACK integrated with JSXGraph enabled the design of parametric, multimodal, and sequential assessment tasks that combine symbolic computation, graphical construction, and conceptual reasoning within a single automated environment. Student responses indicate that this approach supports active learning, deeper engagement with economic models, and a more meaningful connection between mathematical formalization and graphical interpretation.
The contribution of the study lies not in the use of technology per se, but in demonstrating how automated assessment can expand what is pedagogically assessable. By enabling the automatic evaluation of symbolic expressions, graphical constructions, and parametric modelling tasks, the approach aligns assessment more closely with the representational and conceptual demands of Microeconomics. This perspective shifts automated assessment from a tool for efficiency toward a framework for assessing richer forms of reasoning.
The methodology shows strong potential for transfer to other quantitatively oriented disciplines in which modelling, multiple representations, and symbolic reasoning play a central role.
References
Gerhäuser, H., Ehmann, M., & Miller, A. (2009). JSXGraph: Interactive geometry, plotting, and visualization. Retrieved 25 January 2026, https://jsxgraph.uni-bayreuth.de/talks/svgopen09/jsxgraph.pdf
Gerhäuser, M., Valentin, B., & Wassermann, A. (2010). JSXGraph—Dynamic mathematics with JavaScript. International Journal for Technology in Mathematics Education, 17(4), 211–215.
Sangwin (2013). Computer Aided Assessment of Mathematics. Oxford University Press.
STACK Project. (n.d.). STACK: System for Teaching and Assessment using a Computer Algebra Kernel. Retrieved 25 January 2026, https://stack-assessment.org