Cracking the Code: What Drives Student Success in Introductory Programming Courses?
Cracking the Code: What Drives Student Success in Introductory Programming
Cracking the Code: What Drives Student Success in Introductory Programming Courses?
Ryan
Nguyen, Nikhita Mahajan, Ritu Chaturvedi

School of Computer Science, University of Guelph, Canada
How to cite: Nguyen, R.; Mahajan, N.; Chaturvedi, R. (2026). Cracking the Code: What Drives Student Success in Introductory Programming Courses? In: 12th International Conference on Higher Education Advances (HEAd’26). Valencia, 15-18 June 2026. https://doi.org/10.4995/HEAd26.2026.21816
Abstract
What drives student success in foundational large class programming courses? Using anonymized course assessment data (assignments, quizzes, worksheets, labs, a lab exam, and a final exam), we study which components are most predictive of high achievement. We formulate the task as binary classification—predicting whether a student achieves at least 80% on the final exam—and compare a Random Forest classifier with a K-Nearest Neighbours (KNN) baseline. Random Forest attains approximately 96% test accuracy and provides interpretable feature-importance rankings; KNN reaches roughly 85% accuracy but is more sensitive to class imbalance. Across analyses, practical assessments (especially the lab exam) and major programming assignments emerge as the strongest predictors. We additionally explore Association Rule Mining (Apriori) to surface co-occurring performance patterns and discuss limitations and future directions for deploying learning analytics responsibly in introductory programming courses.
Keywords: learning analytics, Random Forest, KNN, association rule mining, computer science education
1. Introduction
Introductory programming courses are pivotal “gateway” experiences in computer science programs, yet they are also a common point of difficulty and attrition. Students in introductory programming courses are required to develop algorithmic thinking, debugging skills, and comfort with the programming language—all while adapting to the pace and independence of university learning. Understanding which assessed activities most strongly relate to final outcomes can help instructors refine course design, target support, and allocate resources (e.g., tutorial emphasis, practice opportunities, or early-warning interventions). Prior work has explored grade prediction using statistical and machine learning models across a variety of educational settings. However, instructors often need course-specific, interpretable evidence about which assessments matter most and how early signals relate to later performance. In this paper, we analyze assessment-level performance data from an introductory programming course in a university setting. Our research objectives and contributions are listed in section 2.
2. Background Work, Research gaps and Contributions
Prior work in educational performance prediction demonstrates that ensemble methods such as Random Forests can achieve strong accuracy when using student background or institutional variables, but these predictors are often coarse-grained and only weakly actionable for course redesign. For example, the Random Forest study in (Nachouki et al., 2023) emphasizes administrative and prior-performance attributes (e.g., GPA-like indicators), which are useful for global risk identification but provide limited insight into which specific course assessments and learning activities should be strengthened to improve outcomes in an introductory programming context. In contrast, early prediction work in CS1 (Guanin-Fajardo et al., 2024; Llanos et al., 2023) often relies on behavioral telemetry such as attempts and submission timing; while effective for early alerts, such data may not be consistently available across contexts and does not always translate directly into assessment-level instructional changes. Chaturvedi and Ezeife (2017) propose a prediction model for an Intelligent Tutoring System that engineers features from both student interaction logs and student grades, and incorporates task characteristics (e.g., task difficulty). However, they focus only on student success in assigned tasks – with no focus on final-exam performance that instructors typically use for course-level decision. Simon et al. (2016) show that using a shared set of common exam questions for introductory programming courses can reveal substantial differences in student performance across institutions—highlighting why exam-based outcomes can vary by context. This motivates our focus on predicting (and interpreting) final-exam performance within a specific course offering using assessment-level evidence, while acknowledging broader concerns about the consistency and reliability of assessment across courses. Finally, systematic reviews such as (Pires et al., 2024) synthesize the field’s common algorithms and signals but do not provide a course-specific, reproducible case study that links prediction to actionable assessment design decisions in a single offering. These gaps motivate the need for a model that is grounded in gradebook-accessible assessment components, yields interpretable signals about what matters most, and targets a meaningful outcome associated with mastery in programming courses.
Interpretability and actionability are also central challenges for Association Rule Mining (ARM) in education. Educational ARM analysis (Romero et al., 2010; Garćıa et al., 2011) frequently focus on e-learning log data and general course improvement, and in some cases on rare-rule discovery, but they are not typically structured around assessment-score transactions that instructors already possess, nor do they always prioritize instructor-facing rule filtering geared to a concrete pedagogical outcome (such as high final exam performance). Moreover, prior ARM work does not commonly describe pragmatic engineering choices for scaling rule extraction over large gradebooks in a transparent way. Accordingly, we complement prediction with an ARM pipeline tailored to assessment components, explicitly emphasizing rules with final exam performance as the consequent and filtering by high confidence and lift to obtain compact, interpretable patterns that can guide instructional adjustments.
2.1. Contributions
In response to these gaps, this study (i) formulates a course-specific prediction task for a large introductory programming course by operationalizing a clear mastery-oriented outcome (high final exam performance) and using only gradebook-accessible assessment components, enabling broader applicability where fine-grained telemetry is unavailable (ii) evaluates a strong ensemble baseline (Random Forest) alongside a contrasting instance-based learner (KNN), and reports interpretable feature signals that identify which assessments most strongly relate to high performance; and (iii) introduces an Apriori-based ARM pipeline over discretized assessment transactions that prioritizes final-exam consequents and applies confidence/lift-based filtering (with scalable processing choices) to produce a small set of actionable, instructor-readable rules. Together, these elements connect predictive accuracy with explanatory patterns, supporting both early identification and evidence-informed assessment redesign.
3. Methodology and Evaluation
3.1 Predicting high scores
In this section, we define our dataset and steps used to prepare for the proposed prediction models, Random Forest (RF) and KNN. Student performance data from an introductory programming, fairly large class in volume (class size > 300) is used. Each row corresponds to a student and each column corresponds to an assessment component (e.g., assignments, quizzes, labs, lab exam, final exam). To preserve anonymity, student identifiers are replaced with a synthetic ID.
We define our class label, and techniques used to prepare data for the prediction models, making sure that distribution of the features after preprocessing kept the original data patterns while putting all features on a common scale for modeling. Class Label / Target definition: The primary outcome is whether a student earns at least 80% on the final exam. This threshold distinguishes high performers from other students and yields a binary classification task. Data cleaning and missing values: Non-assessment metadata columns are removed. Missing or non-finite values (NaN) are replaced with 0 to allow model training. We do note that more principled imputation (e.g., median imputation or model-based imputation) could be explored in future work. Feature scaling: Because different assessments are measured on different scales, numeric predictors were scaled before modeling to map each feature into [0, 1]. In addition to raw assessment scores, we introduced a small number of aggregate features, including Total Assignment Points (the sum of Assignment 1–3) and Average Quiz Score (the mean of Quiz 1–11), to capture category-level performance without altering the underlying score distributions. Note that Assignment 1 assesses foundational C syntax and loops, while Assignment 2 targets user-defined functions and one-dimensional arrays. Assignment 3 requires sequential file processing and 2D data structures. Quizzes are weekly based off the topic of the week. Lab exams are monitored and completed in a lab setting, where students are given a problem to code, compile and run in a constrained environment. Figure 1 shows how the transformations kept the original data patterns while putting all features on a common scale for modeling.
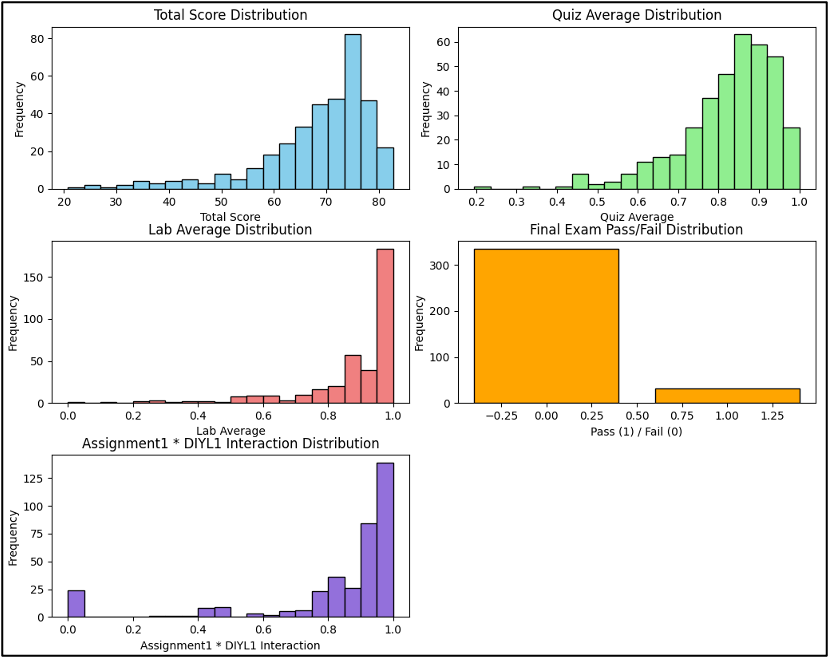
Figure 1. Distribution of features after data preparation / normalization
3.1.1. Choice and Evaluation of Prediction models
We evaluate two supervised models using an 80/20 stratified train–test split to preserve class proportions. We train a baseline Random Forest (scikit-learn RandomForestClassifier, random_state=42, default hyperparameters), reporting accuracy, precision, recall, F1-score, and the confusion matrix, with metric formulas adapted from Chaturvedi and Ezeife (2017) and noting its suitability for tabular educational data and feature-importance outputs (Nachouki et al., 2023). We also train a standardized KNN baseline (KNeighborsClassifier, k=5) and evaluate it with the same metrics; because high final-exam performance may be less frequent, we emphasize precision/recall and the confusion matrix rather than accuracy alone.
Random Forest achieves approximately 96% accuracy on the held-out test set and exhibits relatively balanced performance across classes. KNN achieves 85% accuracy, but tends to favor the majority class, reducing recall for the minority class. This is consistent with KNN’s sensitivity to class imbalance and local neighborhood density. Figure 2 shows the complete classification report of the models and demonstrates the high performance of random forest.
3.1.2 Instructional implications
A major advantage of Random Forest is interpretability through feature-importance rankings.
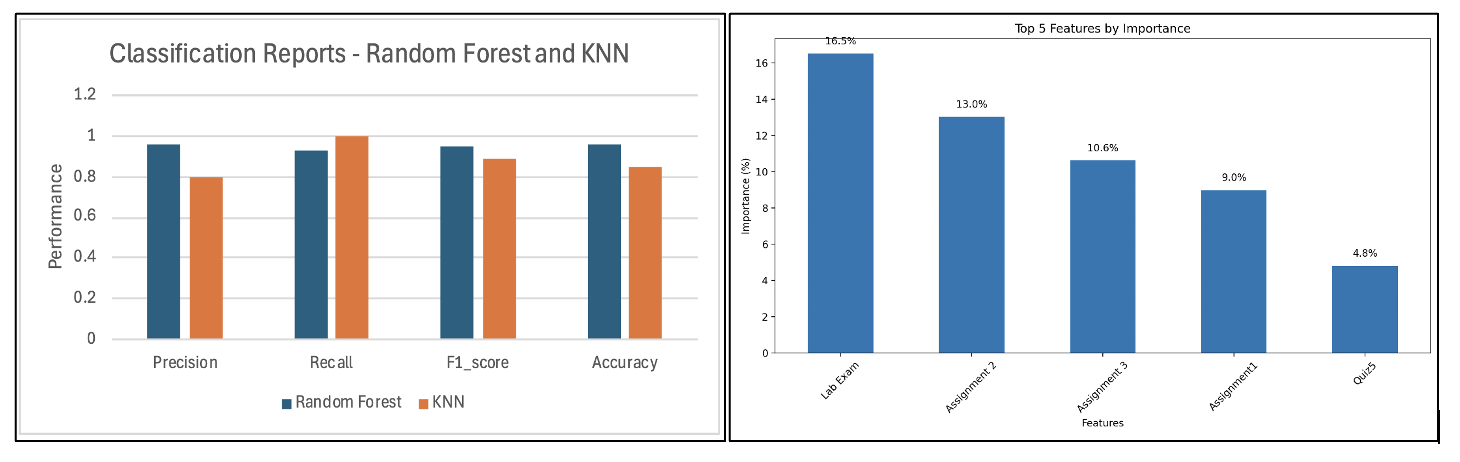
Figure 2. Classification Report of RF, KNN models and Top 5 features by RF
The lab exam and several major assignments appear among the top predictors of high final-exam performance, as shown in Figure 2. A plausible pedagogical explanation is that the lab exam assesses hands-on programming under exam-like constraints (e.g., limited external help), closely matching the skills needed on the final exam. Similarly, programming assignments reinforce debugging and problem-solving over longer time horizons. If practical assessments strongly predict final outcomes, instructors may consider increasing structured lab practice, scaffolding lab exam preparation, or using early lab performance as a trigger for targeted support. If certain assignments are consistently predictive, they may be candidates for additional formative feedback or optional practice variants.
3.2 Association Rule Mining (ARM)
Here, Association Rule Mining is applied complement predictive modeling with descriptive pattern discovery.
3.2.1 Data Analysis via Scatterplot:
A scatterplot analysis of the data revealed some important observations that were considered when preparing it for ARM. A scatterplot matrix shown in Figure 3 highlights the relationships and distributions of scores across different assessments. Key observations include (1) Distributions: Several variables, such as Final Exam, Lab Exam, and Textbook, show skewed distributions. For example, the Lab Exam exhibits a sharp peak at high scores, indicating many students achieved close to the maximum score. This may introduce bias in the ARM process, as frequent high scores can dominate association rules and obscure relationships among other assessments (2) Correlations: Significant correlations (indicated in the matrix) between certain variables, such as Quizzes Total and Worksheets Total, suggest that strong dependencies exist. For instance, lab exam scores show a relatively strong association with final exam performance (correlation coefficient≈0.54), while in-person lab totals exhibited a comparatively weak association with final exam performance (correlation coefficient≈0.13). These dependencies can lead to redundant or obvious association rules, reducing the novelty and diversity of discovered rules (3) Sparse Data: Variables like Textbook have sparsely distributed points, which could affect the frequency counts used in ARM. Sparse data may lead to rules that lack statistical significance. The skewness and sparsity in certain variables, combined with strong correlations among others, may affect the results of ARM by generating biased rules dominated by highly frequent or skewed attributes and missing meaningful associations. To mitigate these issues, strategies such as discretizing continuous variables, setting minimum support thresholds carefully, and pre-filtering correlated attributes were considered to enhance the quality of the ARM results, Section 3.2.2 has the details.
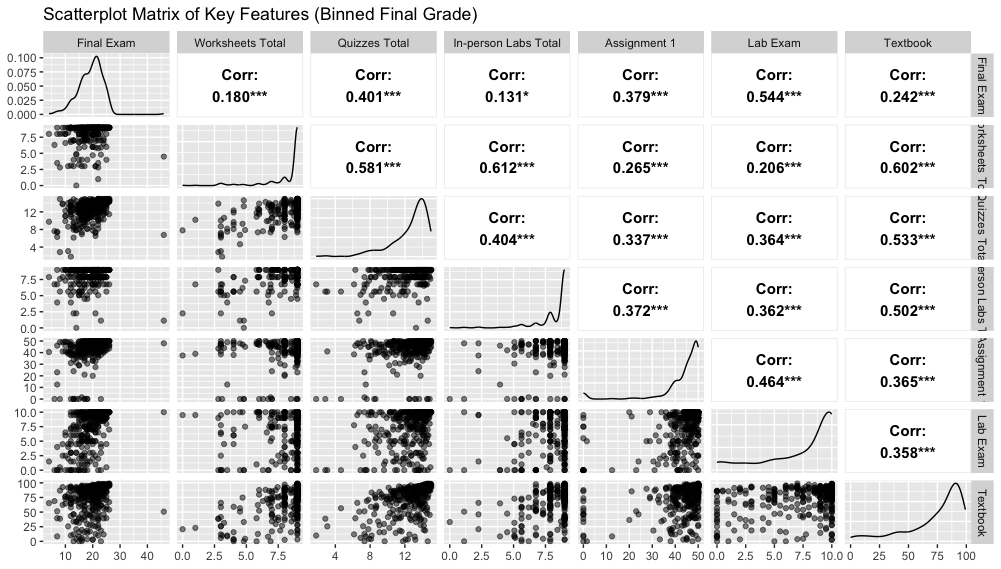
Figure 3. Scatterplot of assessments
3.2.2 Data Preparation for ARM
Normalization was carried out by dividing each score by the total points possible for that assessment. This method ensured that all scores were scaled proportionally to their maximum achievable value, resulting in normalized values ranging from 0 to 1. All continuous assessment scores were normalized by dividing by each assessment’s maximum points. The maximum points for each assessment were extracted from metadata embedded in the column headers of the dataset. Unlike the prediction model’s normalization, which used MinMaxScaler, this approach directly accounted for the structure of the ARM dataset and its metadata-driven organization. We then discretize each assessment into three categories using percentile cutoffs: Low (≤ 33rd percentile), Medium (33rd–66th percentile), and High (≥ 66th percentile). These categories are converted to one-hot (binary) indicators to satisfy Apriori’s categorical input requirements. For example, let 𝑥 = 0.70 denote a normalized assessment score, with percentile thresholds 𝑞0.33 = 0.60 and 𝑞0.66 = 0.80. Since 𝑞0.33 < 𝑥 < 𝑞0.66, the score is assigned to Medium category and encoded as (Low= 0, Medium= 1, High= 0).
3.2.3 Mining Association Rules and Filtering
We mine frequent itemsets with minimum support 0.34 and generate rules with minimum confidence 0.95. We chose this support threshold, because of the high volume of rules that were generated for any value less than 34% - even with 34%, the total number of rules generated were 39,839. We prioritize rules with meaningful lift (e.g., lift > 1.5) and, when possible, rules whose consequent relates to final-exam performance. To maintain interpretability and computational efficiency, the maximum size of itemsets was limited to five items. This process identified common combinations of performance levels, such as students achieving high scores in specific quizzes and lab exams, which frequently co-occurred across the dataset.
From the frequent itemsets, association rules were generated to uncover meaningful relationships. A confidence threshold of 95% was applied, retaining only highly reliable rules. The generated rules took the form If {A, B, C} →Then {D}, where {A, B, C} are the antecedents, and {D} is the consequent. Some sample rules that were generated are shown in figure 4. After generating association rules, additional post-processing steps were applied to filter and prioritize meaningful rules. Rules with the final exam as a consequent were emphasized, as they directly addressed the research goal of understanding factors influencing final exam performance. Rules were further filtered to retain those with confidence values exceeding 95% and lift values greater than 1.5. Redundant or overly complex rules were removed to maintain clarity and focus on actionable insights.
3.2.4 Educational Insights from ARM
The ARM analysis revealed some insights into student success. High performance in lab exams showed a strong correlation with high final exam scores, highlighting the importance of practical, hands-on assessments. This connection suggests that lab exams provide students with opportunities to apply theoretical knowledge in a controlled, exam-like setting, which directly supports skill development needed for final evaluations. Similarly, consistent high scores across quizzes were linked to overall success, under- scoring the role of regular engagement and practice in academic achievement. Quizzes likely help students reinforce their under- standing incrementally, ensuring steady progress throughout the course. However, the insights were limited due to preprocessing challenges and methodological constraints.
4. Conclusion, Limitations and Future Works
Using assessment-level data from an introductory programming course, we compared Random Forest and KNN for predicting high final-exam achievement and identifying influential predictors. Random Forest provided strong predictive performance (≈96% accuracy) and interpretable feature importance, highlighting practical assessments (notably the lab exam) and major assignments as key correlates of final success. ARM offered complementary descriptive patterns but was sensitive to preprocessing decisions.
Future work includes the following (i) evaluate additional models (e.g., gradient boosting), (ii) address class imbalance with resampling or class weights, (iii) incorporate temporal/early-semester features for earlier interventions, and (iv) validate findings across multiple offerings to strengthen generalizability.
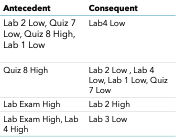
Figure 4. Sample Association Rules generated by our model
References
Chaturvedi, R., & Ezeife, C. I. (2017, August). Predicting student performance in an ITS using task-driven features. In 2017 IEEE international conference on computer and information technology (CIT) (pp. 168-175). IEEE. https://doi.org/10.1109/CIT.2017.34
García, E., Romero, C., Ventura, S., & De Castro, C. (2011). A collaborative educational association rule mining tool. The Internet and Higher Education, 14(2), 77-88. https://doi.org/10.1016/j.iheduc.2010.07.006
Guanin-Fajardo, J. H., Guaña-Moya, J., & Casillas, J. (2024). Predicting academic success of college students using machine learning techniques. Data, 9(4), 60.[crossref]
Llanos, J., Bucheli, V. A., & Restrepo-Calle, F. (2023). Early prediction of student performance in CS1 programming courses. PeerJ Computer Science, 9, e1655. [Crossref]
Nachouki, M., Mohamed, E. A., Mehdi, R., and Abou Naaj, M. Student course grade prediction using the random forest algorithm: Analysis of predictors’ importance. Trends in Neuroscience and Education 33 (2023), 100214. https://doi.org/10.1016/j.tine.2023.100214
Pires, J. P., Brito Correia, F., Gomes, A., Borges, A. R., & Bernardino, J. (2024). Predicting student performance in introductory programming courses. Computers, 13(9), 219. [CrossRef]
Romero, C., Romero, J. R., Luna, J. M., and Ventura, S. Mining rare association rules from e-learning data. In Educational Data Mining 2010 (2010), ERIC. [Crossref]
Simon, B., Sheard, J., D’Souza, D., Klemperer, P., Porter, L., Sorva, J., Stegeman, M., and Zingaro, D. Benchmarking introductory programming exams: Some preliminary results. In Proceedings of the 2016 ACM Conference on International Computing Education Research (New York, NY, USA, 2016), ICER ’16, ACM, pp. 103–112. [crossref]